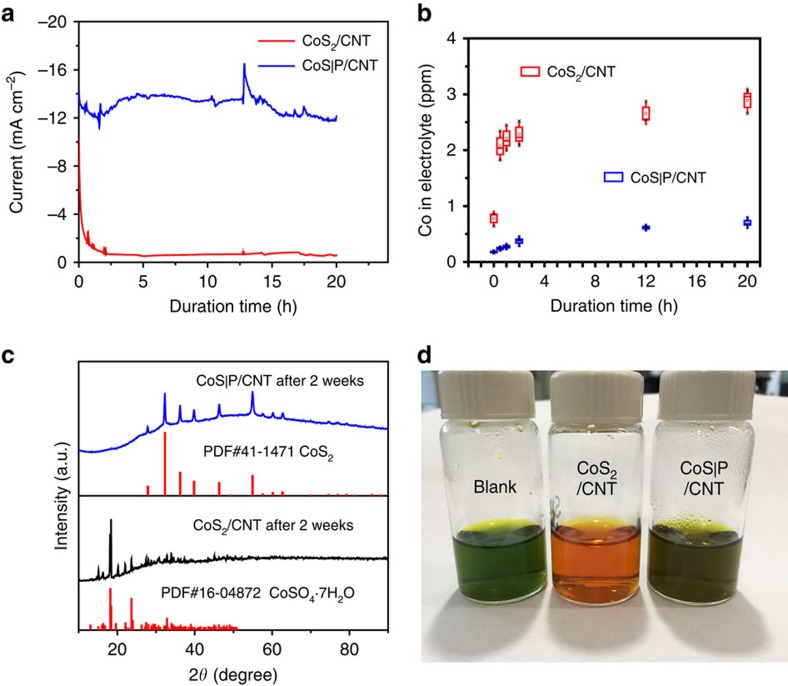
Figure 5. Comparison of chemical stability and catalytic durability between CoS2/CNT and CoS|P/CNT.
(a) Typical chronoamperometric responses (j∼t curves) of the CoS2/CNT and CoS|P/CNT catalysts driving hydrogen evolution at the overpotential of 77 mV without iR compensation for 20 h in 0.5 M H2SO4 solution. About 0.4 mg of each catalyst was loaded on a carbon fibre paper with 0.5 cm2 of active area. The sharp current fluctuations were caused by the sampling of electrolyte during the electrolysis process. (b) Box plots (median and quartiles) representing the concentrations of Co dissolved in 20 ml of electrolyte as the HER catalysis proceeds. The vertical whiskers represent the s.d. The statistics are derived from at least three independent measurements. (c) XRD patterns of CoS2/CNT and CoS|P/CNT after 2 weeks of storage in ambient conditions. (d) Colorimetric comparison of the CoS2/CNT and CoS|P/CNT hybrids soaked in 0.5 M H2SO4 solution for 2 h; Nitrite R salt was used as the colour indicator.

