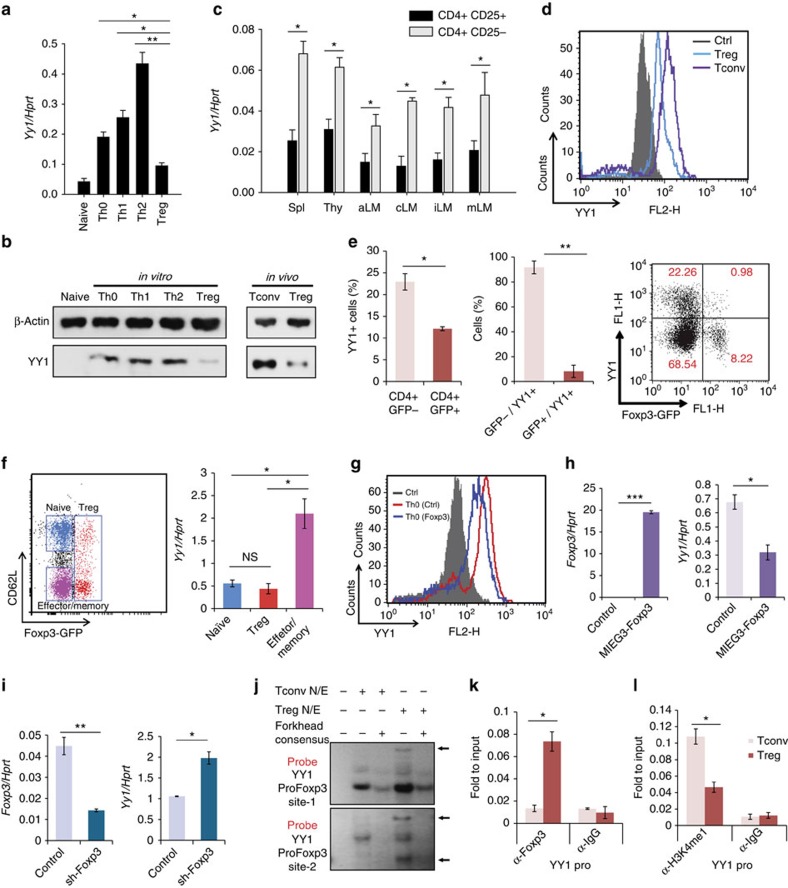
Figure 1. Expression of YY1 is low in Treg cells.
(a) Naïve CD4 T cells from WT mice were differentiated into Th0, Th1, Th2 and Treg cells for 5 days. Relative amount of Yy1 transcript was measured by qRT–PCR. (b) Relative amounts of YY1 protein in in vitro-differentiated CD4 T cells or splenic Tconv (CD4+CD25−) and Treg (CD4+CD25+) cells were measured by immunoblot analysis. (c) Relative amounts of Yy1 transcript in Tconv and Treg cells in axillary (aLN), cervical (cLN), inguinal (iLN) and mesenteric (mLN) lymph nodes and spleen (spl) were detected by qRT–PCR. (d) Amounts of YY1 protein in Tconv or Treg cells were measured using flow cytometry. IgG: isotype control. (e) CD4 cells were enriched from splenocytes of Foxp3-eGFP mice, and then YY1 underwent intracellular staining. The percentage of YY1+ cells from CD4+GFP+(Treg) and CD4+GFP−(non-Treg) were shown (left), the percentage of Treg (GFP+) and non-Treg (GFP−) from YY1+ cells were shown (centre) and the FACS plot is shown (right). (f) CD4 T cells from Foxp3-eGFP mice were stained with CD62L antibody. Naïve, effector and Treg cells were sorted (left) and relative amounts of Yy1 transcript were measured by qRT–PCR (right). (g) Control GFP vector or Foxp3 expression vector was transduced into Th0 cells. After 4 days, YY1 protein was detected by flow cytometry. IgG: isotype control. (h) GFP+ cells from g were isolated, and relative amounts of Yy1 and Foxp3 transcripts were measured using qRT–PCR. (i) WT naïve CD4 T cells were transduced with GFP containing control or sh-Foxp3 vectors and differentiated into Treg cells for 4 days. Relative amounts of Yy1 and Foxp3 transcripts were measured using qRT–PCR. (j) Binding of Foxp3 to two YY1 promoter regions was detected by EMSA using Tconv and Treg nuclear extracts with forkhead consensus sequence (x80). Arrows indicate Foxp3-DNA complexes. (k–l) Binding of Foxp3 (k) and H3K4me1 (l) in Treg or Tconv cells was measured by ChIP assay. Error bars shown in (a), (c), (f), (h), (k) and (l) represent s.d. Statistical differences in (a), (c), (f), (h), (k) and (l) were analysed by Student's t-test (n=3). *P<0.05, **P<0.01. Experiments were performed at least three times with similar results.

