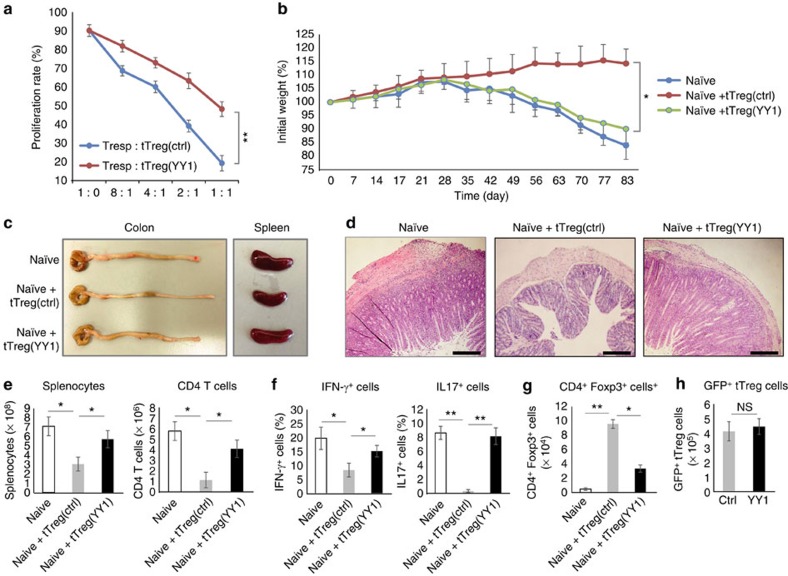
Figure 4. YY1 impairs immunosuppressive function of tTreg cells in vitro and in vivo.
(a) In vitro immunosuppressive activity of tTreg cells was assessed by proliferation of CD4+CD25− Tresp cells (labelled with CFSE from CD45.1+ Tresp cells). Foxp3+ Treg cells were isolated from Foxp3-RFP knock-in mice and transduced with control or YY1-expression vector. GFP+ control tTreg (tTreg(ctrl)) or GFP+ YY1-overexpressing tTreg (tTreg(YY1)) cells were sorted, mixed with CD4 Tresp cells in various ratios, and cultured in the presence of anti-CD3/CD28 beads for 3 days. Proliferation was measured on CD45.1+ (Tresp) cells. (b–h) In vivo immunosuppressive activity of tTreg cells was assessed by inflammatory bowel disease model. tTreg (ctrl) and tTreg (YY1) cells were prepared as in a from Foxp3-RFP knock-in mice. Naïve CD4 T (CD4+CD25−CD62L+CD45RBhigh) cells alone or together with tTreg (ctrl) or tTreg (YY1) cells were adoptively transferred into RAG1−/− mice. The mice were killed at 12 weeks after the cell transfer, and analysed for disease phenotypes. (b) Body weight of the recipient mice was presented as a percentage of the initial weight. (c) Gross morphology of colons and spleens. (d) Haematoxylin and eosin staining of colon sections. Scale bar indicates 200 μm. (e) Absolute numbers of splenocytes and splenic CD4 T cells. (f) Frequency of cytokine-producing effector CD4 T cells in the spleen. (g) Absolute numbers of CD4+Foxp3+ cells from the spleen. (h) Absolute numbers of GFP+ tTreg cells from the spleen. Error bars shown in b–h represent s.d. Statistical differences in b–h were analysed by Student's t-test (n=5). *P<0.05. **P<0.01. NS, not significant.

