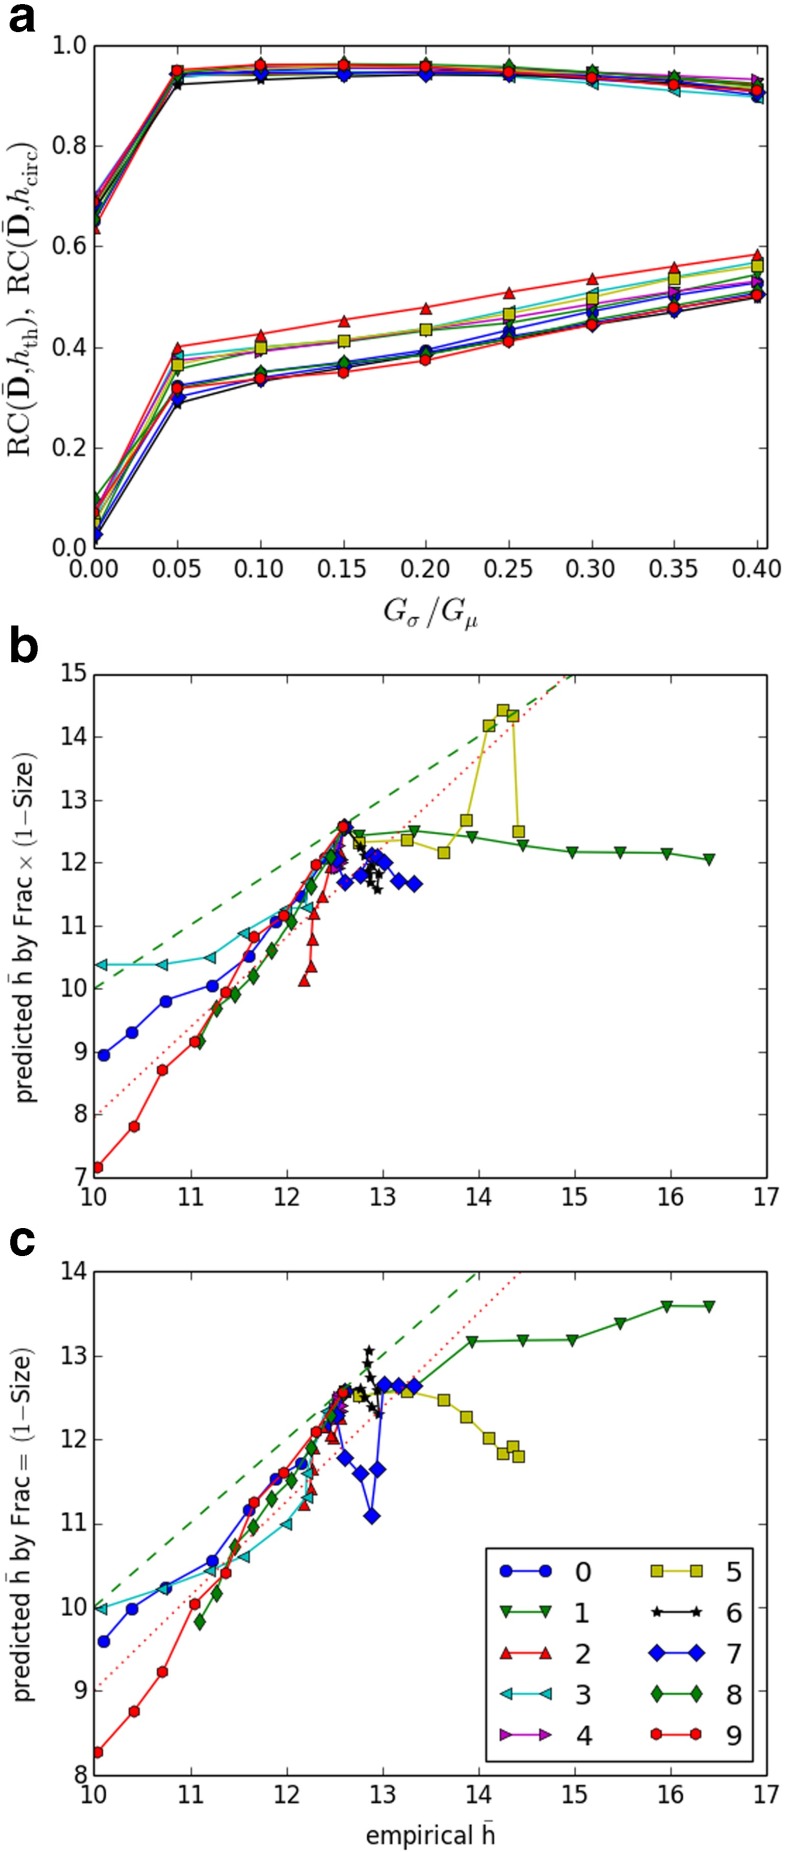
Fig. 7.
a rank correlation between chain activation frequency () and the measure of participation in (upper curves) and between and (lower curves). b, c: predicted mean number of waves () versus empirical mean number of waves by (b) peak value of , (c) ; identity line, green dashed; regression line, red dotted. For each RMP the sequence of points for G σ/G μ = 0.0,0.05,…0.4 is connected by line segments. The first point (G σ/G μ = 0.0) is close to the identity line and is almost the same for all sequences

