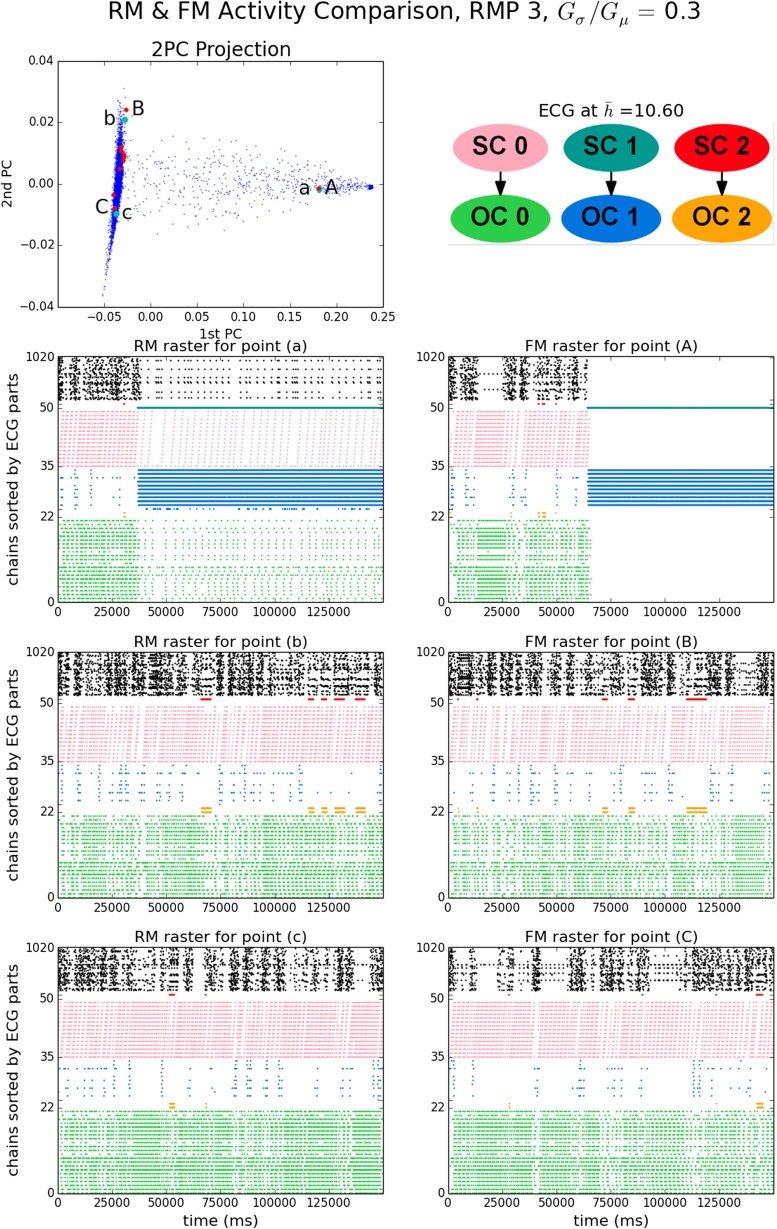
Fig. 8.
Condensed ECG (cECG) for , 2PC projection of NEECs, and selected EE rasters for RMP 3, G σ/G μ = 0.3. Top left panel: As in Fig. 5. Top right panel: cECG. Remaining panels: EE rasters of Fig. 5 with chains colored according the node in cECG to which they belong, and rows permuted so that chains in the same cECG node are adjacent

