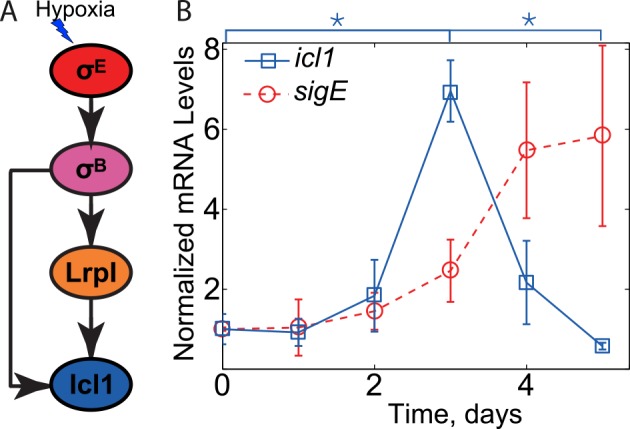
Fig 1. Non-monotonic induction of icl1.

(A) Structure of icl1 transcriptional regulation network. The central metabolism gene icl1 was previously thought to be solely controlled by a simple feedforward network under hypoxic conditions. Arrows represent positive transcriptional regulation. (B) Expression measurements for icl1 and the accessory sigma factor sigE mRNA (data from [12]). Three independent experiments were performed, and the means (error bars are ± standard deviations) are reported, normalized to the mean value of the first data point. While sigE copy number is increasing, icl1 peaks at day 3 and decreases after that. (*p≤0.05).
