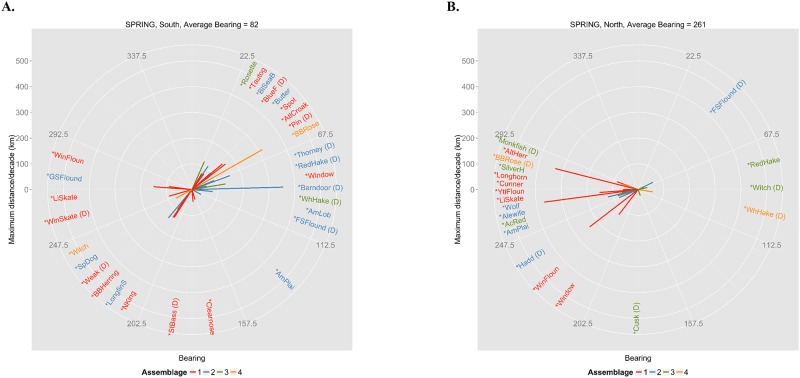
Fig 4. Spring compass plot.
Bearing (0–360 degrees) and distance (km) between the centers of biomass in the first (1968–1978) and fourth (2001–2012) periods for each core species for (A) the Mid-Atlantic Bight and Georges Bank (southern NES) and (B) the Gulf of Maine and U.S. Scotian Shelf (northern NES) sampled during spring bottom trawl surveys. Full species names corresponding to abbreviations can be found in S1 Table. The presence of a ‘(D)’ after an abbreviation refers to a species that has a significant deepening trend over the entire time series.

