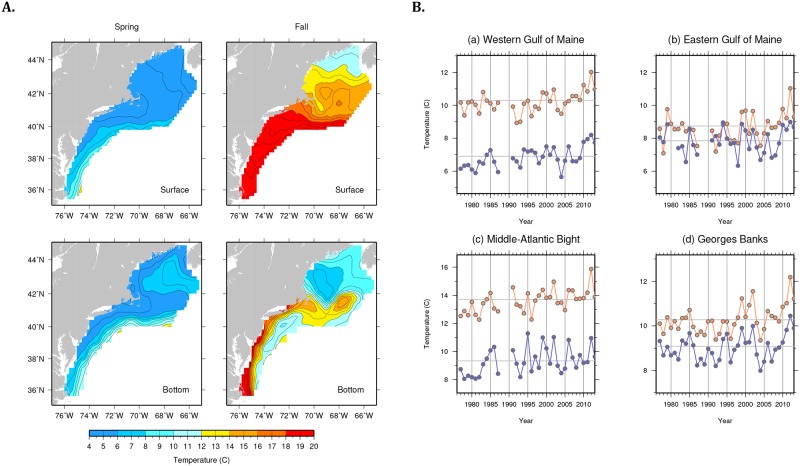
Fig 5. Bottom and surface temperature on the U.S. Northeast Shelf.
(A) Interpolated, average (1977–2013) surface and bottom temperatures on the northeast shelf from the NEFSC spring and fall bottom trawl surveys. (B) Regional time series of bottom temperature (blue) and surface temperature (orange) computed as area-weighted means of all survey points within a given region. The horizontal lines in each panel represent the average over the reference period (1977–2013).

