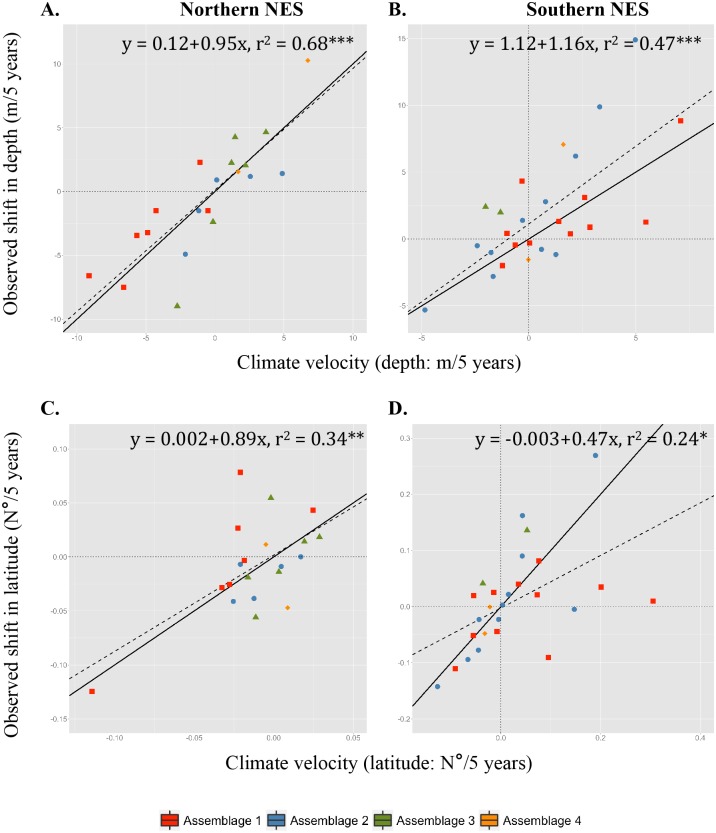
Fig 7. Spring climate velocities.
Slopes of observed versus predicted changes in depth (A, B) and latitude (C, D) for the Gulf of Maine (northern NES; A, C) and Mid-Atlantic Bight/Georges Bank (southern NES; B, D) sampled during the spring bottom trawl surveys. Colors correspond to the species clusters (red: cluster 1S; blue: cluster 2S; green: cluster 3S; yellow: cluster 4S). Significance is indicated by ‘ns’: not significant; ‘*’: p < 0.05; ‘**’: p < 0.01; ‘***’: p < 0.001. Solid black line is the 1:1 relationship and dashed black line corresponds to the linear model fit and provides a reference point for whether the clusters are moving faster or slower relative to climate velocity with respect to latitude and depth.

