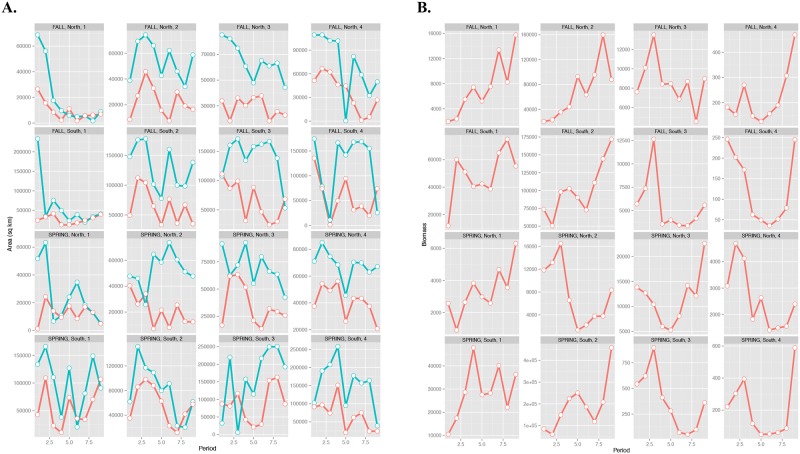
Fig 8. Assemblage spatial extent, thermal area, and biomass.
(A) Trends in five-year averages of assemblage spatial extent (blue lines) and predicted thermal habitat area (red lines). Area is defined by the kernel densities of the assemblage biomass with values greater than one standard deviation above the mean for the assemblages defined in each season and region. (B) Comparative trends five-year averages of summed biomass for each assemblage.

