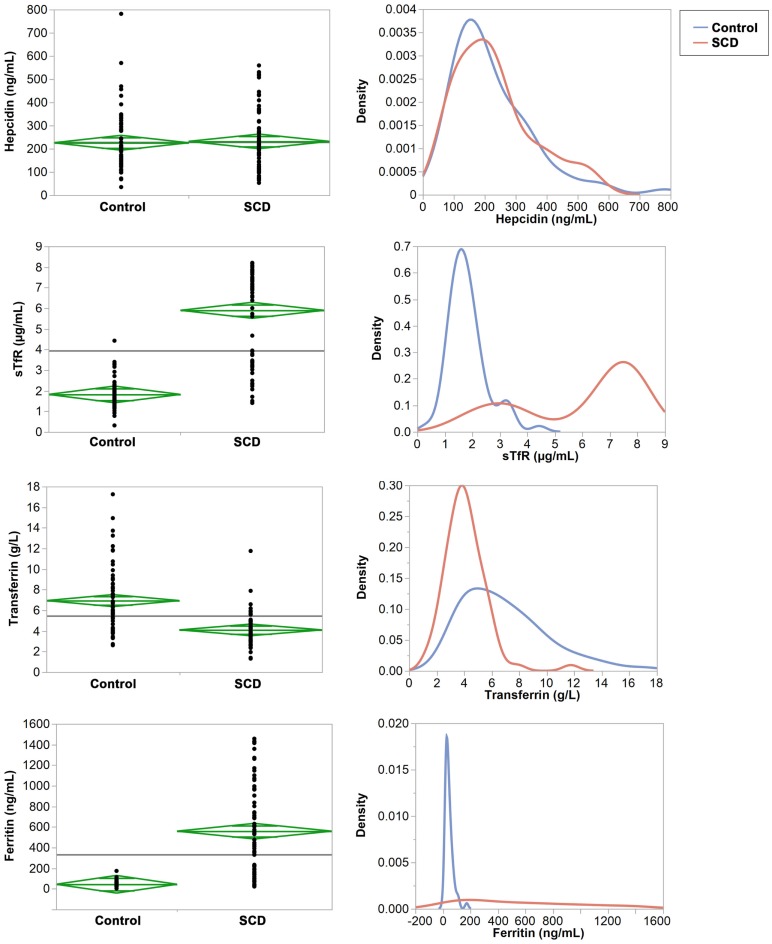
Figure 1.
Comparisons of means and variances of the four iron serum proteins in the control and SCD groups. Right panel: the diamonds show the 95% confidence intervals and the horizontal black line shows the mean value across the entire set of individuals. Left panel: the densities show the distribution of each protein in the control and SCD groups.

