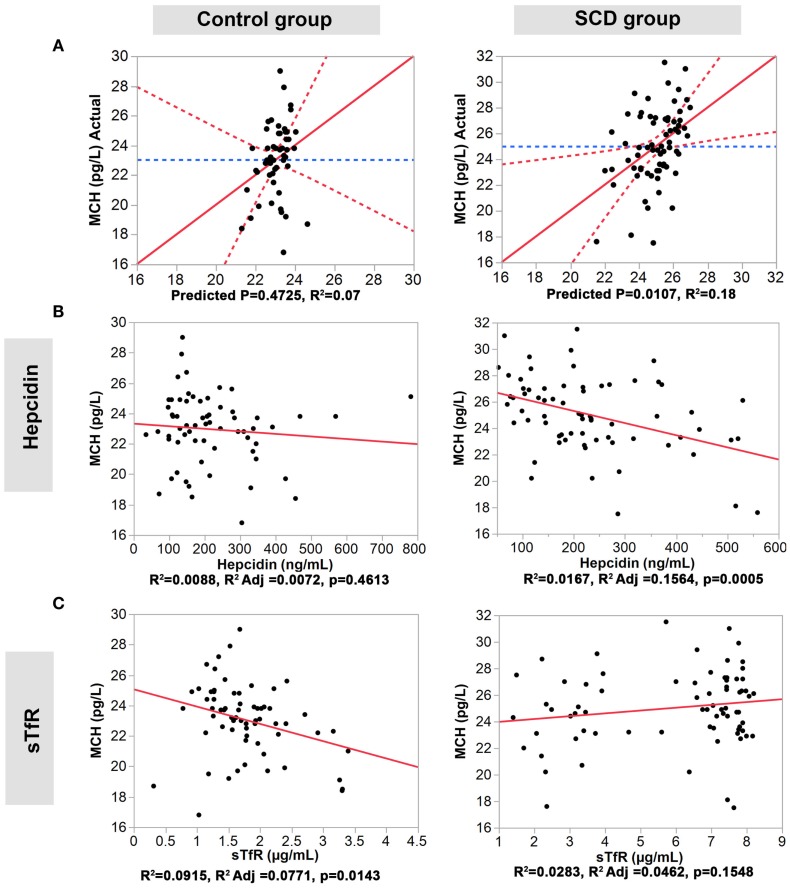
Figure 3.
Association of hepcidin and sTfR with MCH in the control and SCD groups. (A) Full multivariate models (control group, left panel, and SCD group, right panel). (B,C) Univariate models testing the association of each protein (control group, left panels, and SCD group, right panel). The red solid line shows the line of fit, the red dashed line represents the 95% confidence curves and the blue dashed line shows the horizontal mean reference that represents the null hypothesis.

