Figure 4.

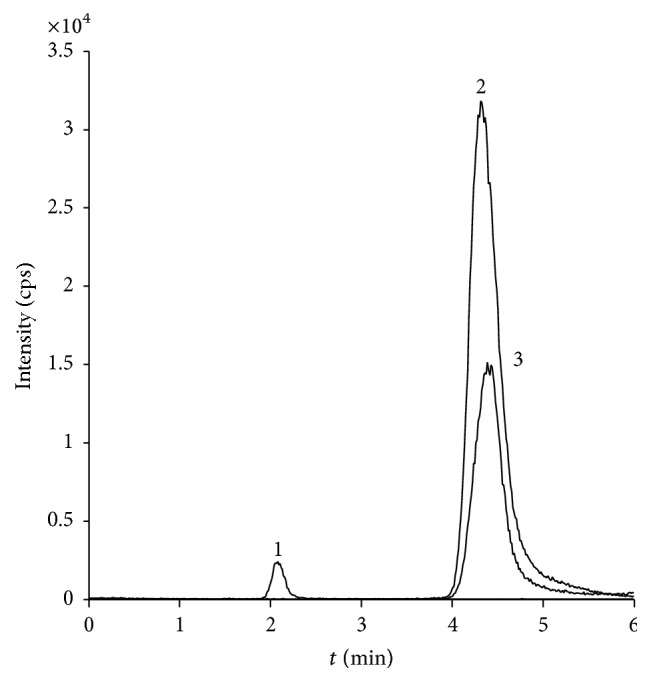
MRM chromatogram of an extracted soil sample with peaks representing m/z transitions (1) 252 → 126, (2) 180 → 72, and (3) 180 → 84. Peak areas correspond to 0.5 μM of muramic acid and 15.3 and 1.4 μM of glucosamine and galactosamine, respectively.
