Figure 4.
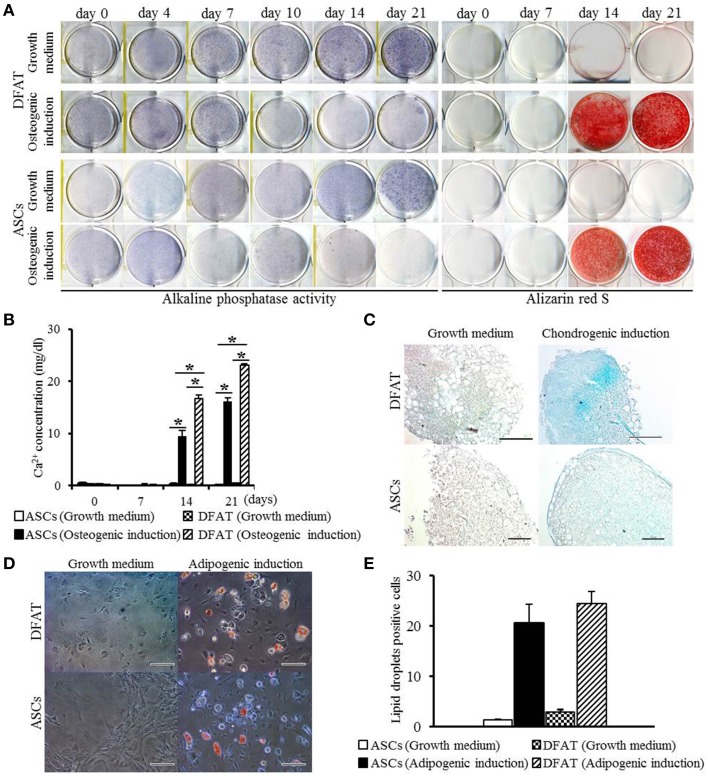
Multilineage potential of DFAT cells and ASCs. (A) ALP activity and Alizarin red staining, examined to detect osteogenic potential of DFAT cells, and ASCs. (B) Calcium concentration determined by quantitative colorimetric assay. Each bar represents the mean ± SD (n = 12); *P < 0.05. (C) Cells stained for Alcian blue to determine chondrogenic differentiation. Scale bar = 100 μm. (D) Adipogenic differentiation evaluated by staining with Oil red O. (E) Oil red O-positive lipid droplets were measured in DFAT cells and ASCs under growth and adipogenic induction media. There was no significant difference between DFAT cells and ASCs on the cell number stained by Oil red O.

