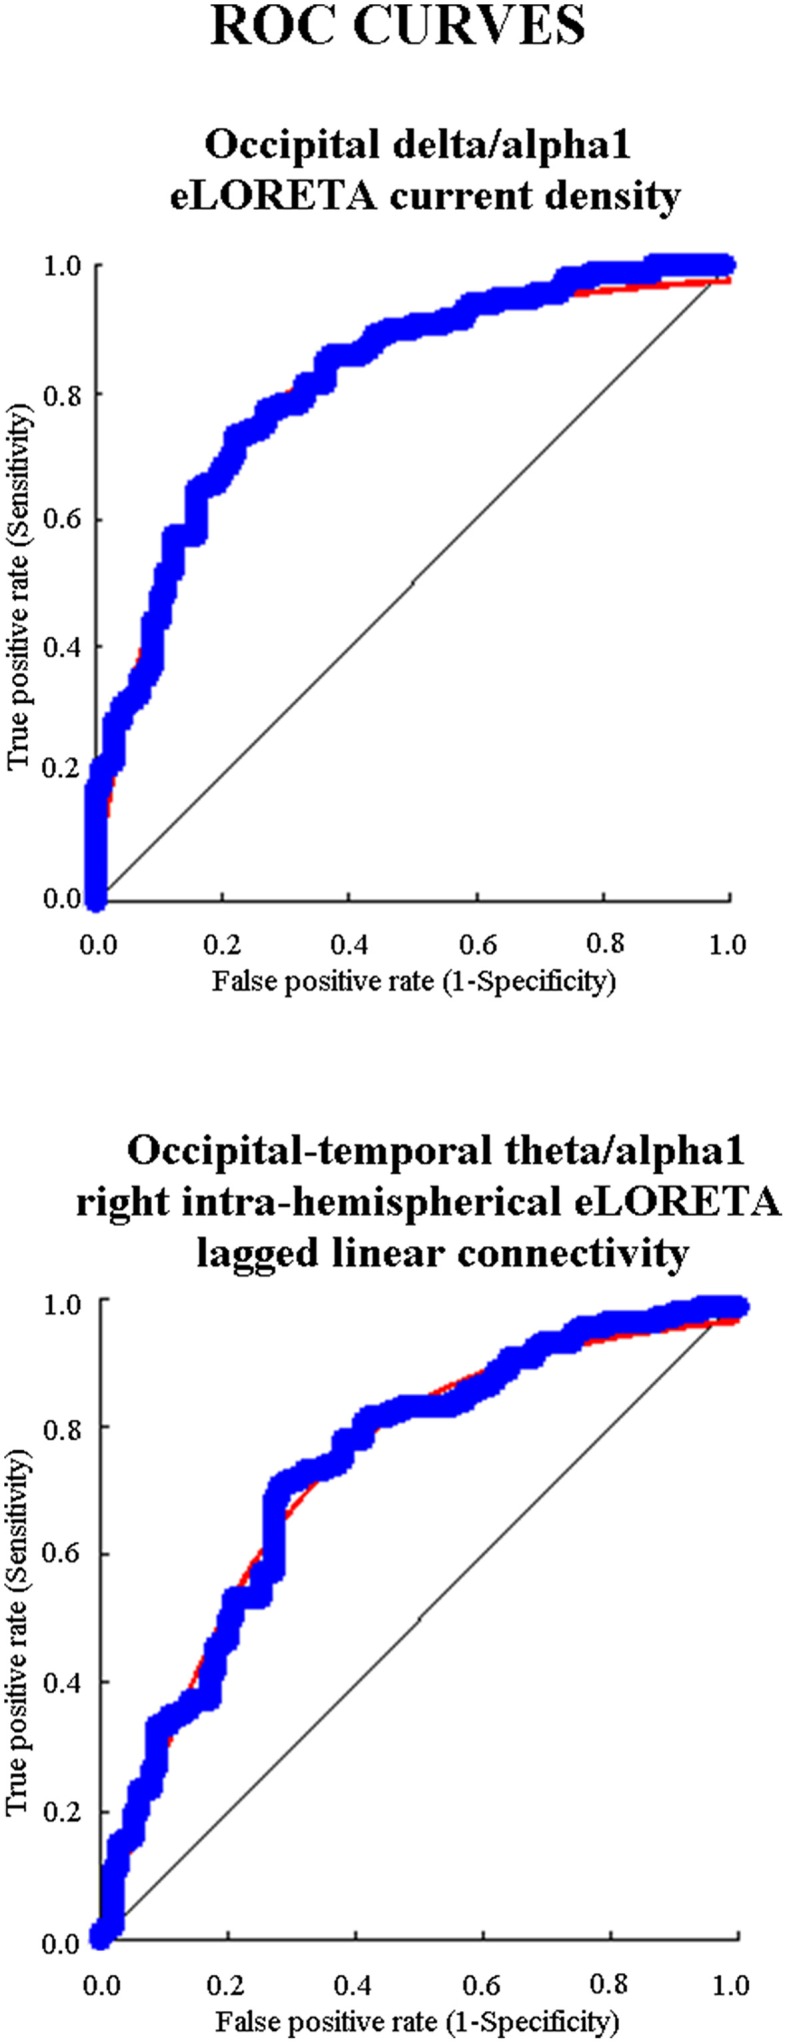
Figure 6.

Diagram showing the ROC (receiver operating characteristic) curves that illustrate the performance of the EEG markers with the best classification rate of single Nold and AD individuals. The upper panel shows the best EEG marker for source activity and the bottom panel the best EEG maker for functional connectivity. These EEG markers had an area under the ROC curve (AUROC) higher than 0.70 (i.e., 70%), which is the threshold of a moderate classification performance.
