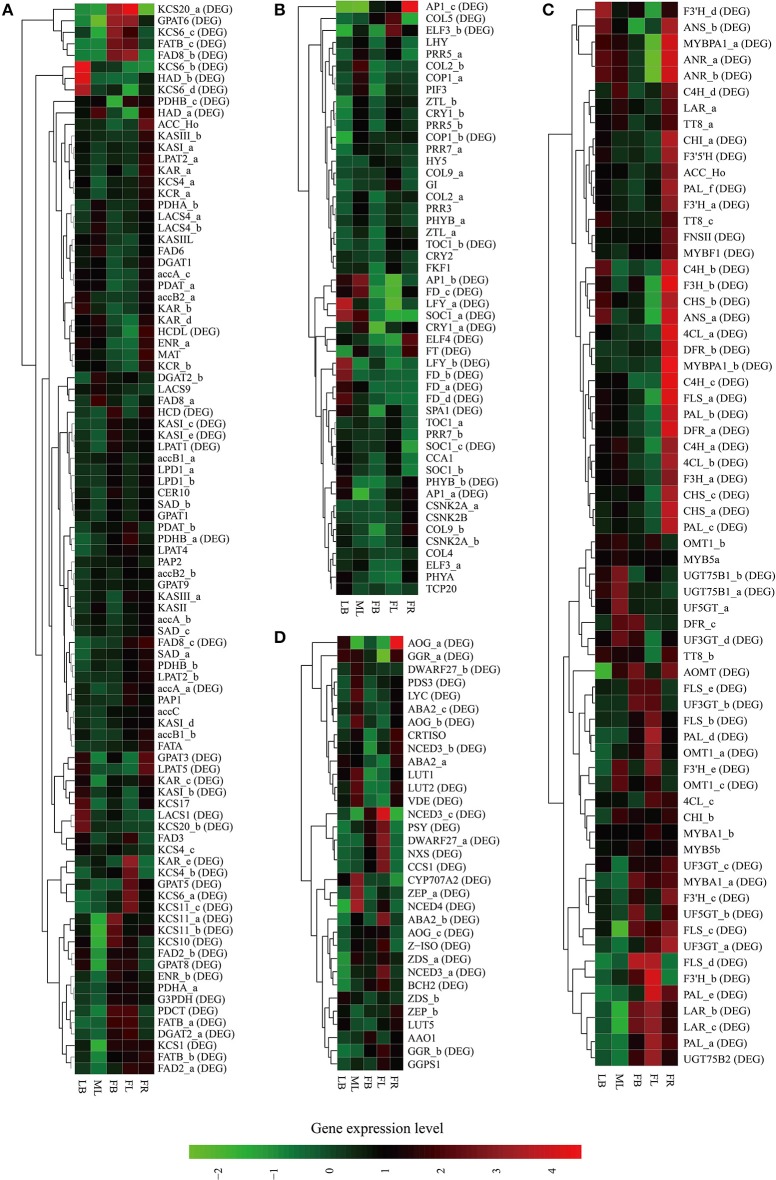
Figure 5.
Heat map representation and hierarchical clustering of putative genes involved in C. reticulata flowering time control (A), TAG biosynthesis (B), flavonoid biosynthesis (C), and carotenoid biosynthesis (D). For gene abbreviations in Figures 4A–D, their full name and other information can be referenced in Supplementary Tables S11–S14, respectively. Expression profiles of these genes across five tissues (LB, leaf buds; ML, mature leaves; FB, flower buds; FL, flowers; FR, immature fruits; SE, seeds) are shown, and DE genes (fold change ≥ 4, FDR ≤ 0.001) are indicated as “DE” in brackets. Green and red colors are used to represent low-to-high expression levels, and color scales correspond to the mean centered log2-transformed FPKM values. A hierarchical cluster dendrogram is shown on the left.

