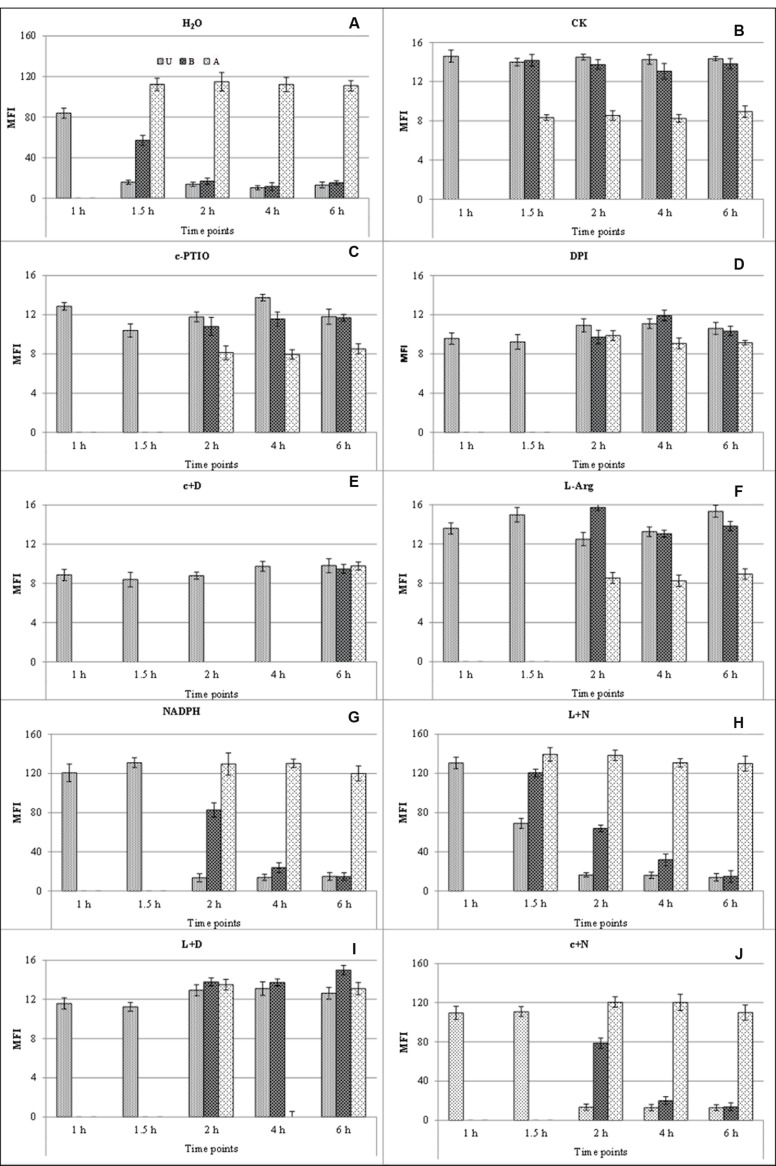
FIGURE 5.
Mean fluorescence intensity of endogenous ROS generated during germination at different time points and treatments. Bright fluorescence was observed after treatment with distilled water (H2O) and H2DCF DA (A); faint fluorescence was observed in distilled water without H2DCF DA staining (CK) (B). U, urediniospore; B, base of germ tube; A, apex of germ tube. c+D, c-PTIO +DPI; L+N, L-Arg +NADPH; L+D, L-Arg +DPI; c+N, c-PTIO +NADPH.

