Figure 1.
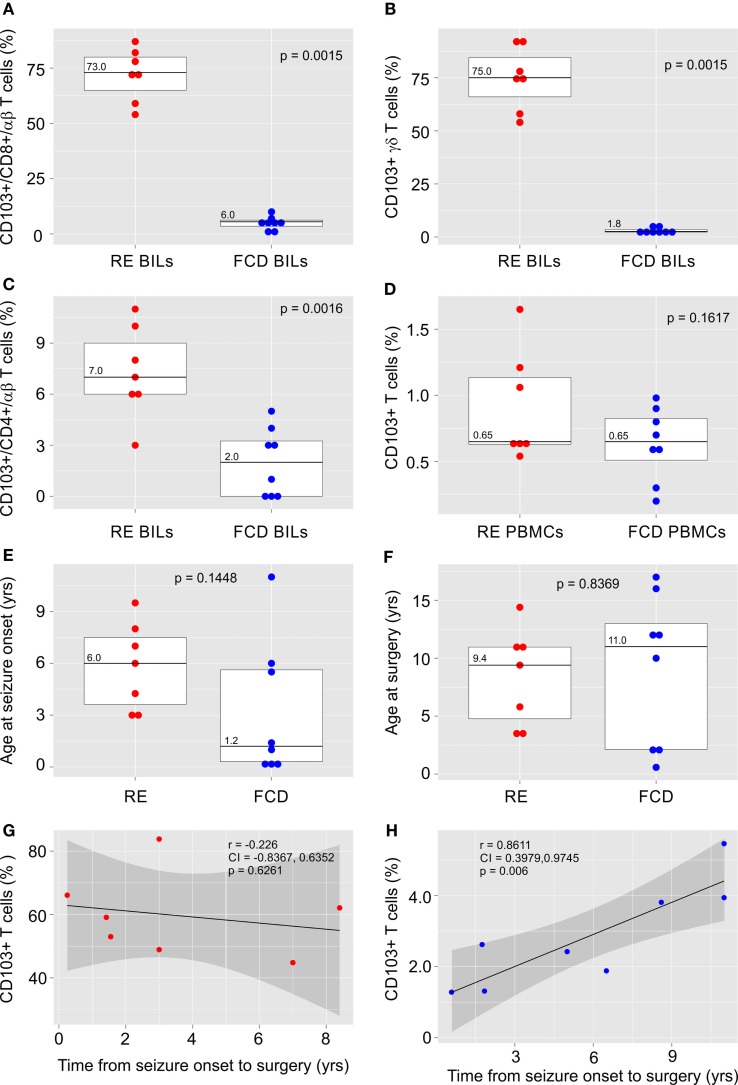
CD103 expression by T cells isolated from RE and FCD brain specimens. Box plots with median values showing the percent of CD8+ αβ T cells (A), γδ T cells (B) and CD4+ αβ T cells (C) in brain-infiltrating lymphocytes (BILs) that are CD103+, and (D) the percent of T cells that express CD103 in peripheral blood lymphocytes (PBMCs) from the same patients. In (E,F) box plots with median values of patient ages at seizure onset and at surgery are shown. Red dots correspond to individual RE cases (n = 7), and blue dots correspond to individual FCD cases (n = 8). Calculated p-values (Mann–Whitney test in A and B and unequal variance t-test in C–F) indicated that there was a significant difference in the relative number of CD103+ T cells in RE BILs compared with FCD BILs, but not in peripheral blood. There was no statistical difference between the FCD cases and the RE cases with respect to the age of seizure onset and age at surgery. The linear correlation between the percent of CD103+ CD3+ T cells in lymphocytes isolated from fresh RE and FCD brain tissue and the length of time between seizure onset and surgery was calculated (G,H), and showed a positive correlation between the relative number of CD103+ T cells in FCD BILs and the length of time between seizure onset and surgery. Pearson correlation coefficients, p-values and 95% confidence limits (shaded areas) are shown.

