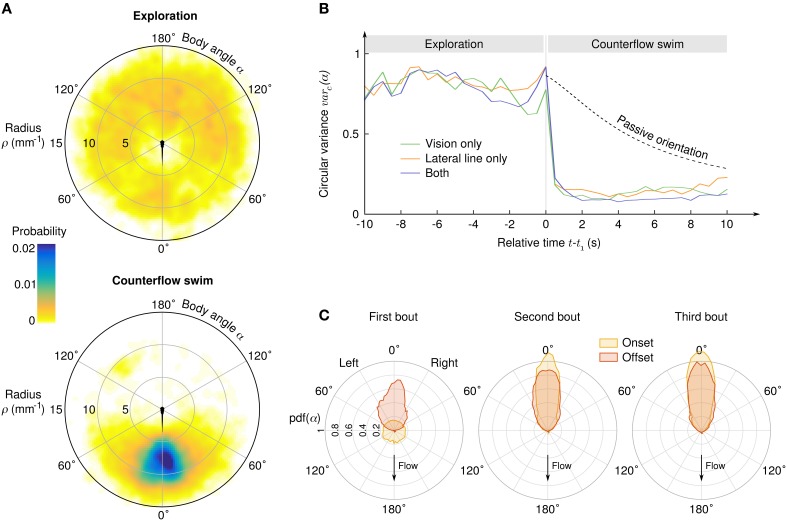
Figure 3.
Transition from exploration to counterflow swim. (A) Probability density of the suction point's location in the reference frame of the larva, before (top) and during (bottom) the counterflow swim sequence. (B) Circular variance of α as a function of the time relative to the first bout of the CSS, for three different sensory conditions. The “passive orientation” curve has been obtained numerically by computing the circular variance of putative trajectories of inert larvae with the same initial conditions (position and body angle). (C) Distributions of the body angle α at the onset (yellow) and offset (red) of the first three bouts of the CSS.

