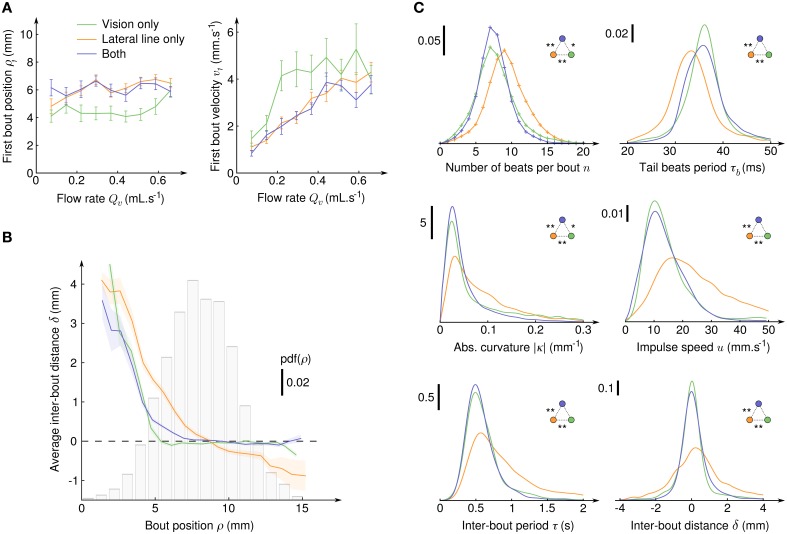
Figure 4.
Initiation, characterization and regulation of counterflow swim sequences. (A) Average radial position ρ1 (left) and fluid velocity v1 (right) at the onset of the first bout of the CSS as a function of the suction flow rate, for the three sensory conditions where CSS is observed. Error bars: standard error. (B) Average inter-bout distance δ as a function of the bout radial position ρ during the CSS. The dashed line at δ = 0 indicates perfect distance holding. The bar plot shows the probability density function of ρ for all three sensory conditions. The colored transparent surfaces indicate standard errors. (C) Probability density functions of six quantities characterizing the intra- and inter-bout behavior during the CSS for the three sensory conditions. Pdf were obtained with kernel density estimation with Gaussian kernels: , , , , , and . Two-sample Kolmogorov-Smirnov tests were used to determine if distributions are significantly different from each other (*p < 10−3 and **p < 10−6).

