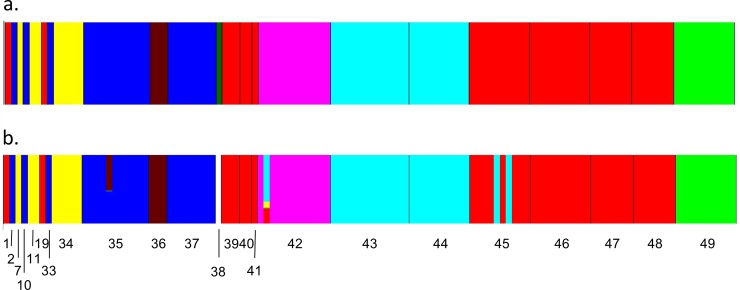
Fig 4. Genetic clusters and degree of admixture identified by the Bayesian clustering method implemented in the program BAPS using only samples collected from the apartment building.
(A) The 8 clusters identified in the apartment samples; each individual is shown by a single narrow bar. (B) Admixture of individuals within each cluster with the height of each color proportional to the degree of admixture. Sample 38 was not included in the admixture analysis because it was placed in its own cluster and the minimum population size used in the admixture analysis was 3 individuals. Cluster colors and numbers correspond to those in Fig 5.

