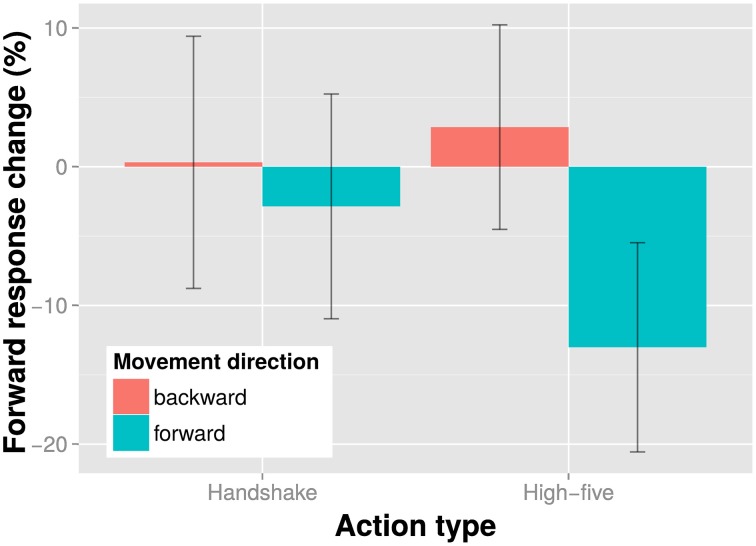
Figure 2.
Results of the direction discrimination task. Shown is the percent response change of the “forward” responses in the experimental conditions relative to the baseline condition (no adaptor presentation) for each action type and movement direction adaptor separately. Bars indicate one SE from the mean.

