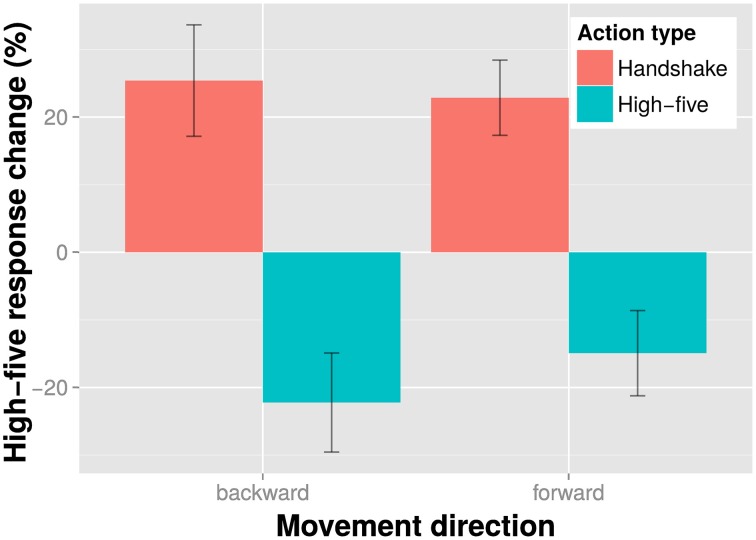
Figure 3.
Results of the action discrimination task. Shown is the percent response change of the “high-five” responses in the experimental conditions relative to the baseline condition (no adaptor presentation) for each action type and movement direction adaptor separately. Bars indicate one SE from the mean.

