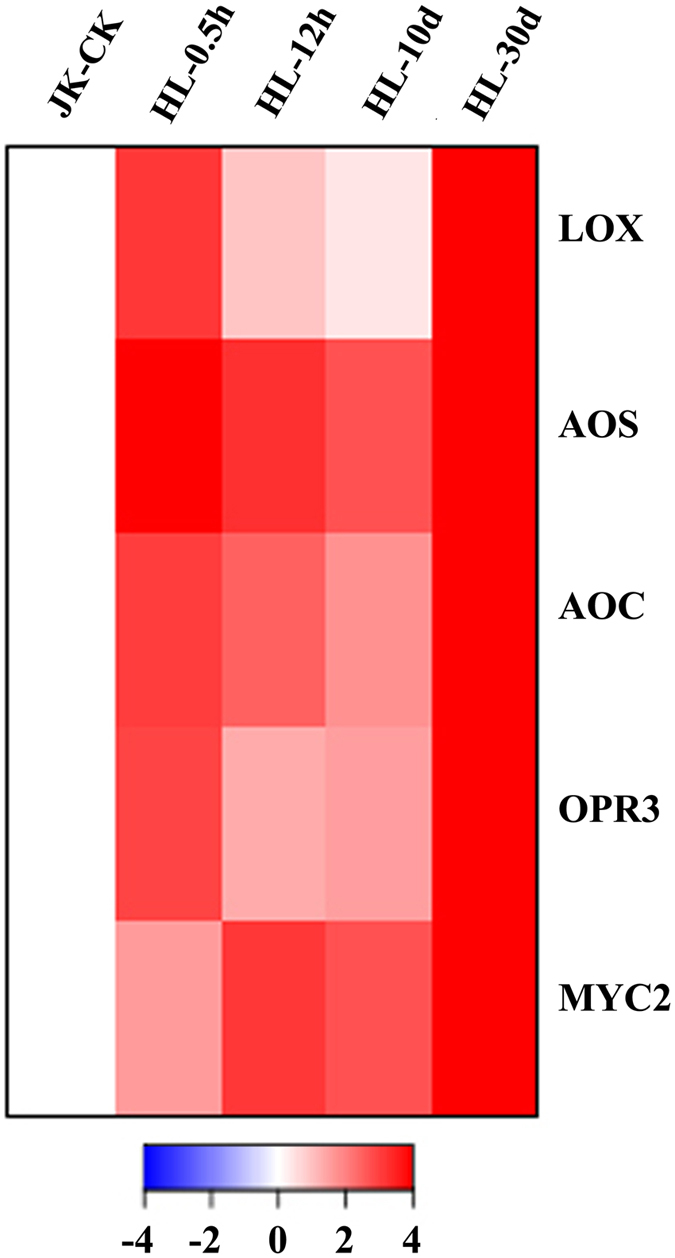
Figure 1. Heatmap of gene expression levels.

This heatmap is based on hierarchical clustering (P > 0.001) of genes involved in JA biosynthesis and regulation. All gene expression levels were transformed to scores ranging from −4 to 4 and were colored blue, white, or red to represent low, moderate, or high expression levels, respectively. The relative expression levels were scaled based on their mean and do not represent expression levels in comparison with controls.
