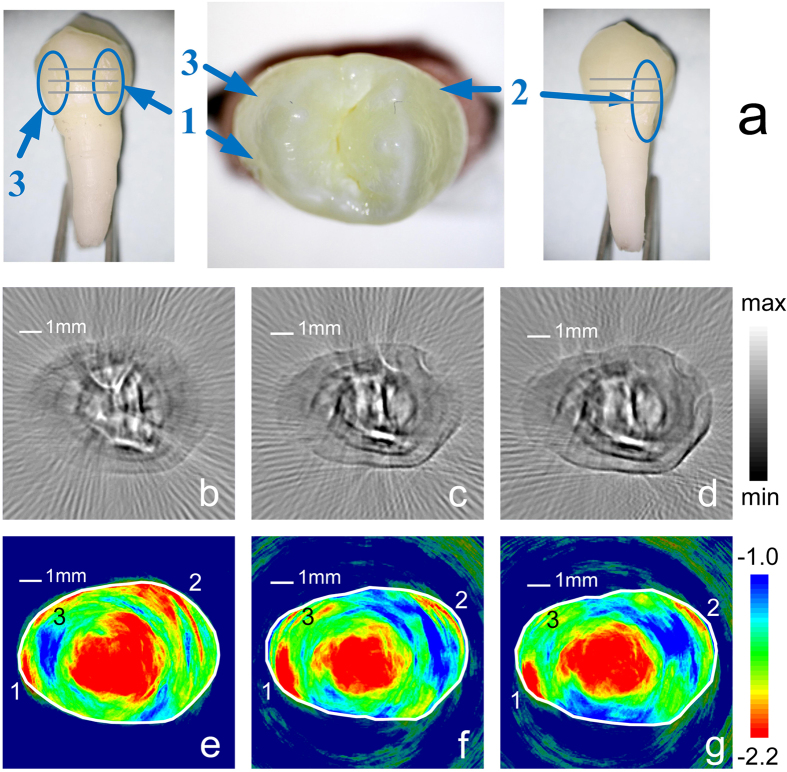
Figure 3. The PAT images of a lesion tooth (T4).
The upper row (a) is the specimen with lesions, which are labeled from one to three. The position is shown. The middle row [(b–d)] and lower row [(e–g)] are B-mode images and S-mode images, respectively. For the middle and lower rows, the three columns from the left to the right are PAT images in three sections from top to bottom of the lesion tooth and the same column are the same section. The approximate positions of imaging section are marked in Fig.3(a) with the gray solid lines. For S-mode PAT images, several significant low slope regions break the annular region with the high slope. Comparing with the corresponding S-mode PAT and the optical image, the low slope regions correspond to the lesions in the tooth and are labeled as the same number. The solid white lines in the S-mode images are manually plotted according to the tooth outline in the corresponding B-mode images.

