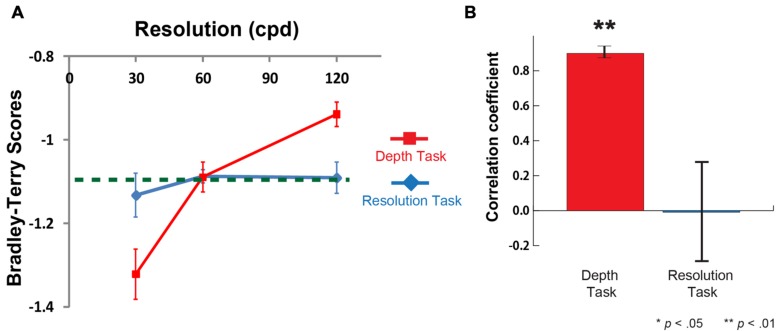
FIGURE 6.
Results of Depth task and Resolution task for Cylinder. (A) Mean Bradley-Terry score for each image in the depth task (a red line) and the resolution task (a blue line) as a function of the resolution (cpd) (n = 8 for Depth Task and n = 8 for Resolution Task). Vertical error bars, ±1 SEM. A Green dashed line represents the chance-level choice rate (50% choice rate in two alternative forced choice). Mean BTS in the depth task at 120 cpd was significantly higher than chance-level (t = 5.45, df = 7, p < 0.01). Mean BTS in the depth task at 30 cpd was significantly lower than chance-level (t = -3.73, df = 7, p < 0.01) (B) Mean correlation coefficient between BTS and the image resolution in Depth and Resolution tasks (n = 8 each). The mean correlation coefficient between depth sensation and the image resolution was 0.90 (n = 8, p < 0.01, against zero). The mean correlation coefficient between resolution sensation and the image resolution was -0.01 (n = 8, p = 0.98, against zero).

