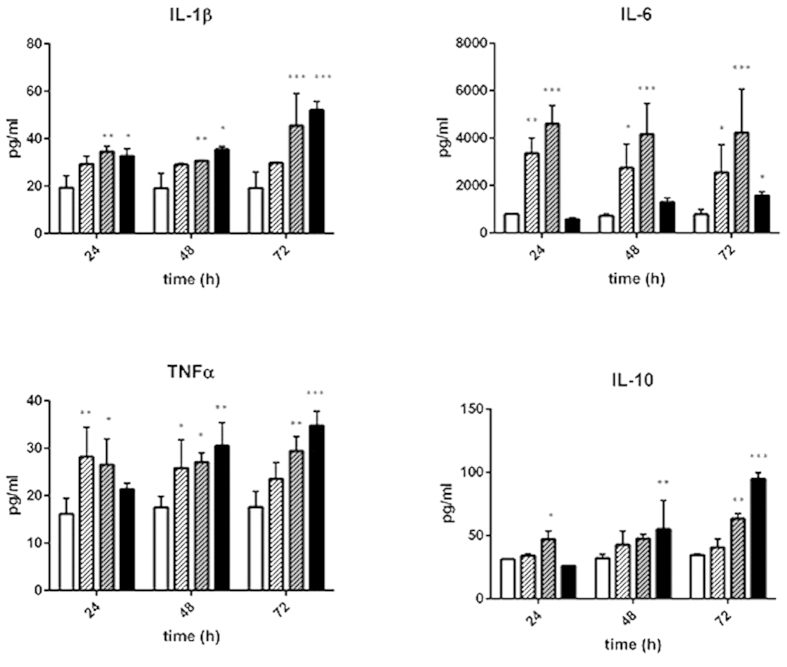
Figure 1. Cytokine profiling of liver organoids stimulated with TLR agonists.
Cytokine release of untreated liver organoids (open bars) was compared to liver organoids treated for 24 h, 48 h or 72 h with Pam3CSK4 (open, shaded bars), LPS (grey, shaded bars) or ODN2006 (black bars). Cell culture medium was exchanged every 24 h. Statistical significance was calculated compared to untreated control after 24 h of culture using two-way ANOVA with Dunnett’s multiple comparisons test (*p < 0.05, **p < 0.01, ***p < 0.001). Results of five independent experiments are shown.

