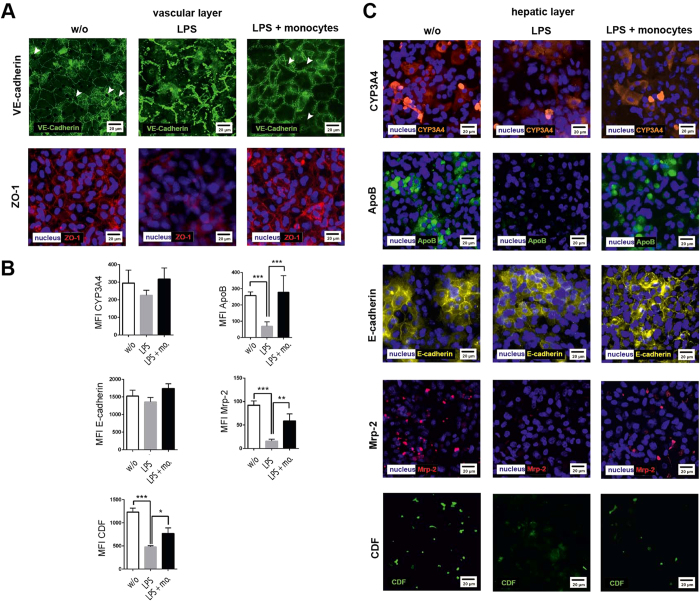
Figure 5. Immunofluorescence staining of endothelial and hepatocyte proteins without stimulation (w/o) and in presence of 100 ng/ml LPS (LPS) or 100 ng LPS and primary monocytes (LPS + monocytes (mo.)).
(A) Expression of VE-cadherin and ZO-1 at the vascular layer. White arrows indicate gaps in the vascular layer. Representative results of three independent experiments are shown. (B) Computational analyses of fluorescence intensities of at least 20 ROI per condition (labeled as mean immunofluorescence intensity (MFI)) of the respective protein using random field analysis in the hepatic layer. Statistical significance was calculated between indicated conditions using student’s t-test (*p < 0.05, **p < 0.01, ***p < 0.001). Immunostaining for (C) CYP3A4 (red), ApoB (green), E-cadherin (yellow), MRP-2 (red), and detection of CDF secretion (green). Nuclei are stained with DAPI (blue). Representative results of three independent experiments are shown.

