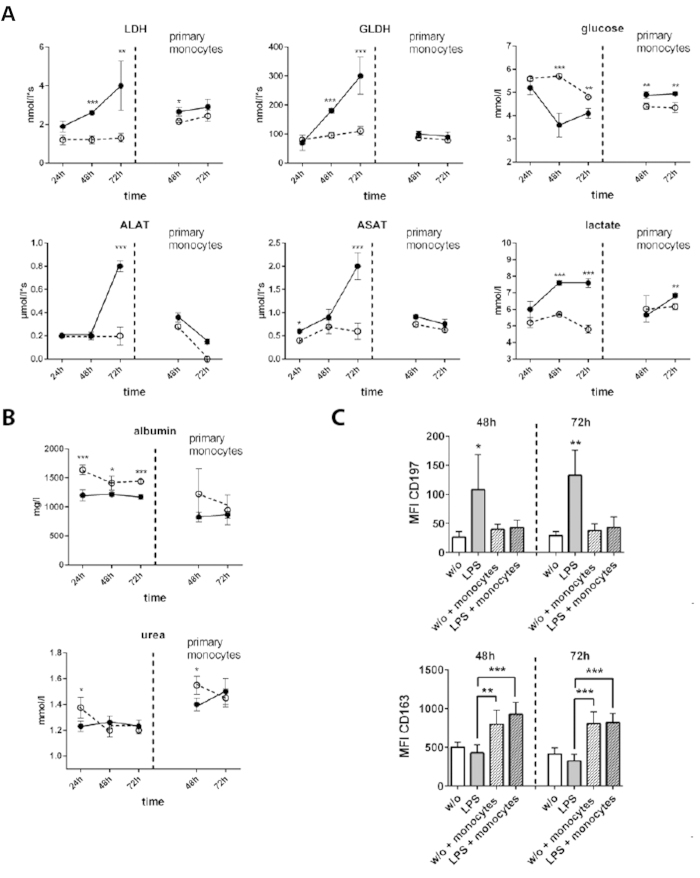
Figure 6. Release of intracellular enzymes and metabolic activity of the liver organoid.
Liver organoids were untreated (dashed line) or stimulated with LPS (solid line), without monocyte perfusion (left from vertical dashed line) or with primary monocyte perfusion (primary monocytes, right from vertical dashed line). (A) Release of lactate-dehydrogenase (LDH), glutamate-dehydrogenase (GLDH), aspartate-transaminase (ASAT) and alanine-transaminase (ALAT). Changes in glucose, lactate consumption. (B) Synthesis of albumin and urea. Statistical significance was calculated between untreated and LPS-treated samples at similar time points and perfusion conditions (*p < 0.05, **p < 0.01, ***p < 0.001) using student’s t-test. (C) Computational analyses of fluorescence intensity of 20 ROI per condition (labeled as mean immunofluorescence intensity (MFI)) of CD197 or CD163 using random field analyses of macrophages in the vascular layer. Liver organoids were cultured for 48 h or 72 h in absence (w/o) or presence of LPS (LPS). Where indicated liver organoids were perfused with monocytes (+monocytes) 24 h after culture and then sub-cultured for indicated times. Significance of CD197 was calculated for condition “LPS treatment without monocytes perfusion” compared to the remaining conditions. For CD163 significance was calculated between indicated conditions. For statistical analysis of CD196 and CD163 expression one-way ANOVA with Bonferroni multiple testing correction (*p < 0.05, **p < 0.01, ***p < 0.001) was used. (A–C) Data of three independent experiments are shown.

