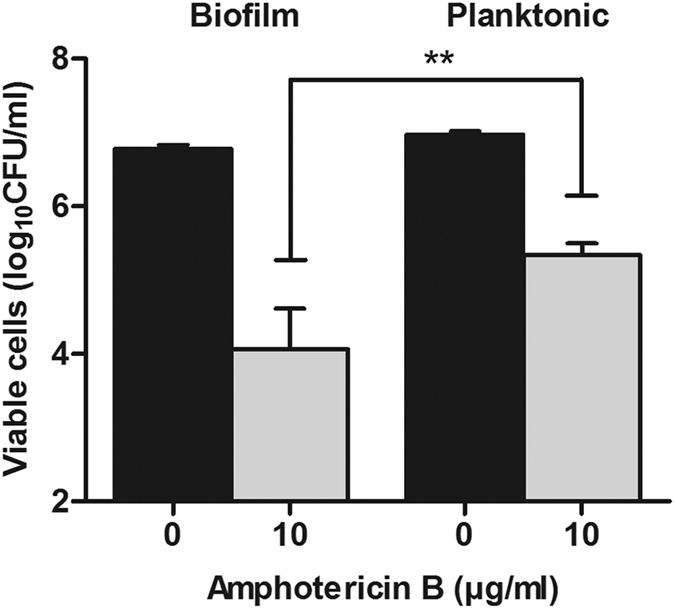
Figure 2. Barcode sequencing screen.

Number of viable cells in the pooled mutant collection measured as colony-forming units (CFUs) of untreated control (black bars) and amphotericin B-treated cells (grey bars). n = 4, error bars show standard deviation. Statistical significance between AmB treated samples of biofilm and planktonic cells was evaluated with Student’s t-test. **P < 0.005.
