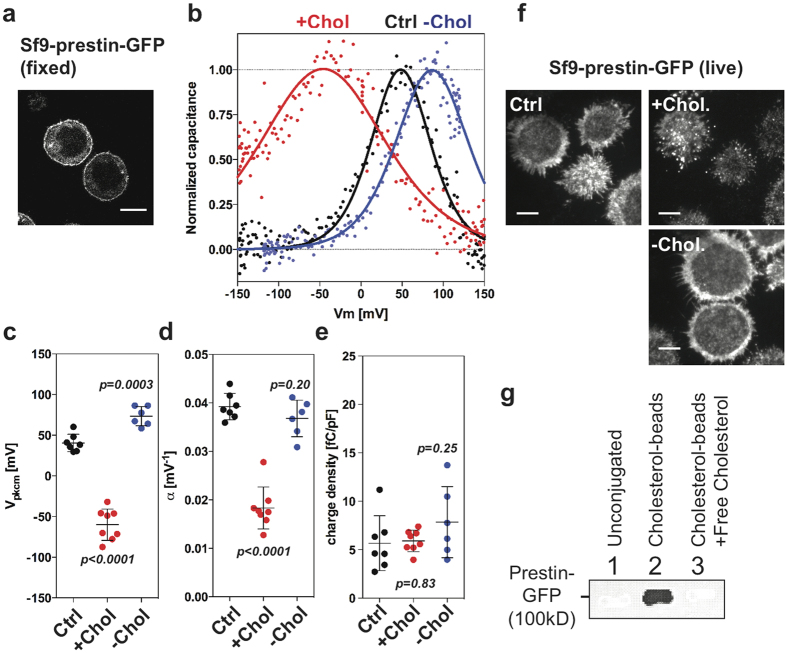
Figure 4. Interaction of prestin and cholesterol.
(a) Representative images of Sf9 cells with prestin-GFP localizes at the plasma membrane. Scale bar, 10 μm. (b–e) Non-linear capacitance (NLC) measurements of stable Sf9-prestin-GFP cells. (b) Whole-cell recordings of Sf9-prestin-GFP cells were performed in control buffer (“Ctrl”), with cholesterol loading (“+Chol”), and with cholesterol depletion (“−Chol”). (c) Vpkcm. Mean ± s.d. are: Ctrl, 40 ± 11 mV (n = 7); +Chol, −60 ± 19 mV (n = 8); −Chol, 73 ± 12 mV (n = 6). P values are as indicated (t-test, compared to Ctrl). (d) alpha. Mean ± s.d. are: Ctrl, 0.039 ± 0.003 mV−1 (n = 7); +Chol, 0.018 ± 0.004 mV−1 (n = 8); −Chol, 0.037 ± 0.004 mV−1 (n = 6). P values are as indicated (t-test, compared to Ctrl). (e) Charge density. Mean ± s.d. are: Ctrl, 5.7 ± 2.8 fC/pF (n = 7); +Chol, 5.9 ± 1.1 fC/pF (n = 8); −Chol, 7.9 ± 3.7 fC/pF (n = 6). P values are as indicated (t-test, compared to Ctrl). (f) Live-cell TIRF imaging of Sf9-prestin-GFP cells with cholesterol manipulation. Sf9-prestin-GFP cells were either grown in control media (“Ctrl”), in media supplemented with 5 mM MβCD (“−Chol”), or 5 mM MβCD saturated with cholesterol (“Chol”) for 1 h and observed under TIRF microscopy. Scale bars, 5 μm. (g) Cholesterol pull-down assay of Sf9-prestin-GFP cells. Cell lysates containing membrane fractions from stable Sf9-prestin-GFP cells were incubated with unconjugated control beads or cholesterol-conjugated beads, separated on SDS-PAGE, and probed with anti-GFP. Prestin-GFP is pulled-down with cholesterol-conjugated beads but not with unconjugated beads (n = 5, p = 0.0059, t-test). Lanes 1, Unconjugated beads; 2, Cholesterol-conjugated beads; 3, Cholesterol-conjugated beads with addition of exogenous free cholesterol.

