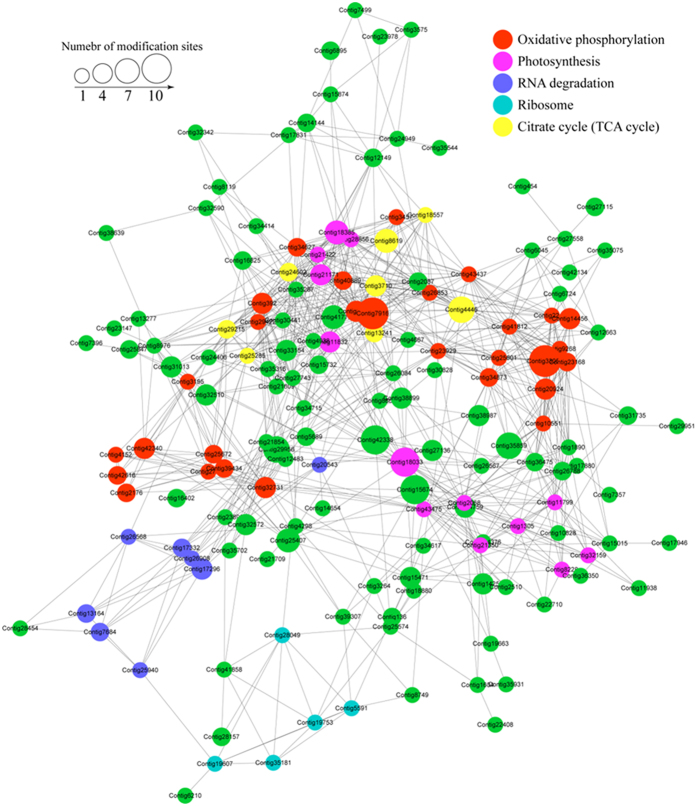
Figure 6. Interaction network of lysine-succinylated proteins analyzed by Cytoscape software (version 3.0.1).
The lysine-succinylated proteins in the top five clusters are shown in red, light purple, blue, cyan and yellow, respectively. Red indicates cluster ‘Oxidative phosphorylation’, light purple indicates cluster ‘Photosynthesis’, blue indicates cluster ‘RNA degradation’, cyan indicates cluster ‘Ribosome’, yellow indicates cluster ‘Citrate cycle’ and green indicates other lysine-succinylated proteins in Taxus × media.

