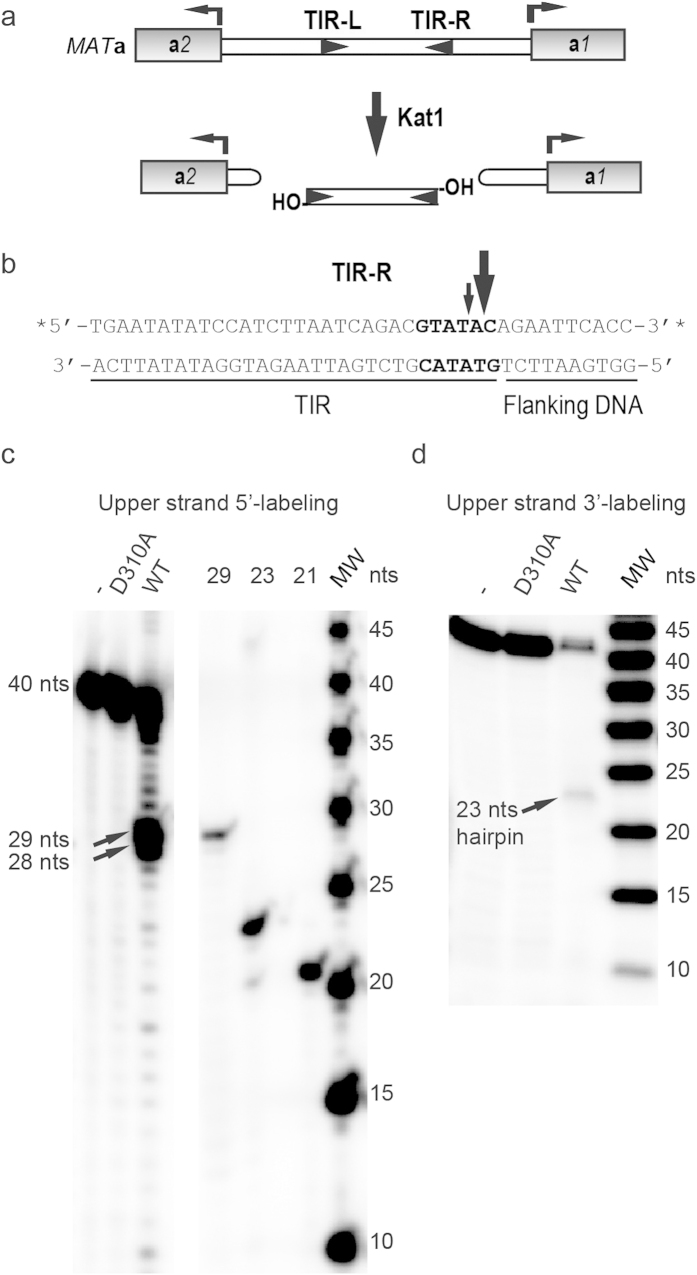
Figure 1. Kat1 cleaves TIR-R close to the transposon end.
(a) Schematic drawing of the MATa1-a2 intergenic region displaying the a1 and a2 genes as grey boxes and the TIRs as arrowheads. Kat1 cleaves the TIRs, generating hairpin-capped DSBs on the flanking DNA and free 3′-OHs on the transposon ends. (b) The sequence of the 40-bp duplex representing TIR-R with 30-bp from the transposon end and 10-bp from the flanking DNA. The GTATAC sequence at the beginning of TIR-R is indicated in bold and major incisions on the upper strand represented by arrows. The asterisks (*) indicate the positions of 32P-label. (c,d) DNA cleavage assay with 5′end labeled (c), and 3′end labeled (d), DNA substrates using WT Kat1, Kat1D310A and no protein (−). Each reaction, containing ~8 nM of substrate and ~200 nM of Kat1, was incubated for 3 hrs at 30 °C, deproteinized and analyzed by 15% denaturing PAGE. The radiogram depicts the 40-nt substrate, the major products formed and size markers. A representative image from at least two independent experiments is shown.

