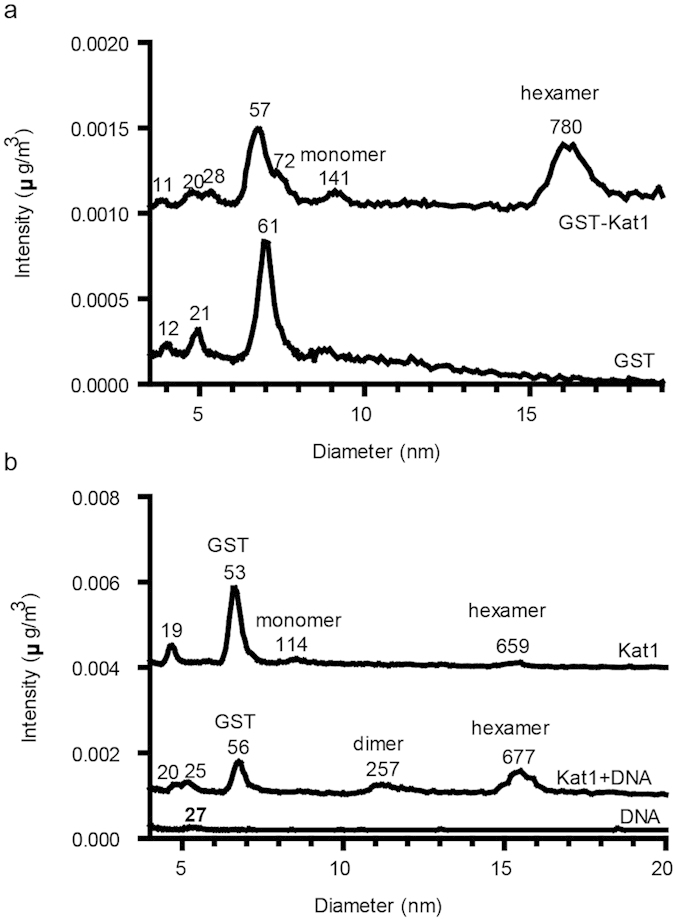
Figure 5. Formation of oligomeric Kat1 assemblies.

(a) GEMMA analysis of GST-Kat1 (top, calculated MW 136 kDa) and GST (bottom, calculated MW 26.9 kDa). (b) GEMMA analysis of 0.085 mg/ml Kat1 alone (top trace, expected monomeric MW 109 kDa), Kat1 together with a 40-bp duplex TIR-R DNA (middle trace) or 0.18 μM of the duplex DNA alone (bottom trace). In the experiment with Kat1 and DNA (middle trace), they were incubated together for 2h at a concentration of 0.43 mg/ml Kat1 (4.0 μM) and 1.4 μM DNA. Next, the mixture was desalted to 100 mM ammonium acetate by gel filtration, diluted twice in water and analyzed by GEMMA (the final protein concentration was approximately 0.05 mg/ml). The processed data in (a,b) displays a mass‐based concentration scale with the baselines of the upper traces shifted in order to fit many experiments in each graph. Molecular masses are indicated on top of the peaks and peaks representing GST and different oligomeric structures of Kat1 are indicated.
