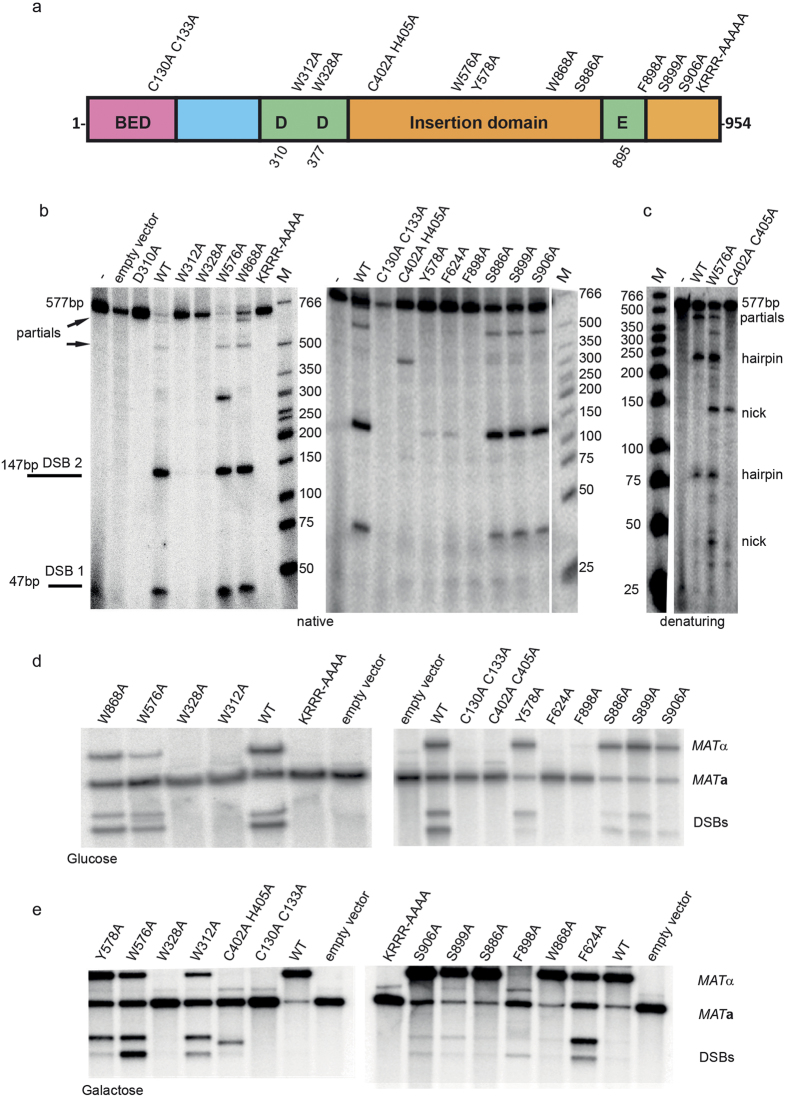
Figure 6. Importance of conserved amino acids for Kat1 function in vitro and in vivo.
(a) Drawing of the functional domains of Kat1. Point mutations in Kat1 analyzed are depicted above the boxes and the positions of the catalytic DDE-residues indicated below. (b) In vitro cleavage assay (as in Fig. 1) with a panel of Kat1 mutations using GST-Kat1 mixed with a 577-bp substrate including both TIR-R and TIR-L, followed by separation on 6% PAGE using native conditions. The position and expected sizes of products, including partials are indicated on the left. Molecular weight designated M is also shown. (c) In vitro cleavage assay using C402A/H405A and W576A Kat1 mutations as in (b), but separated using denaturing conditions. The substrate and products (nicks and hairpins) are indicated. Both DNA strands were labeled in their 5′- ends and incubated with transposase for 3 hrs at 30 °C. (d,e) DNA-blot analysis of BamHI-digested genomic DNA from strain SAY1597 (kat1∆) carrying plasmids expressing the indicated Kat1 mutants using the galactose-inducible GAL1 promoter. The blot was hybridized with a MAT-specific probe. Supplementary Fig. S9 shows a schematic diagram of the MATa and MATα loci. The MATα, MATa, and DSB-bands are indicated on the right. In (d) the strains were grown in glucose (low Kat1 expression) whereas in (e), galactose was used as carbon source (high Kat1 expression).

