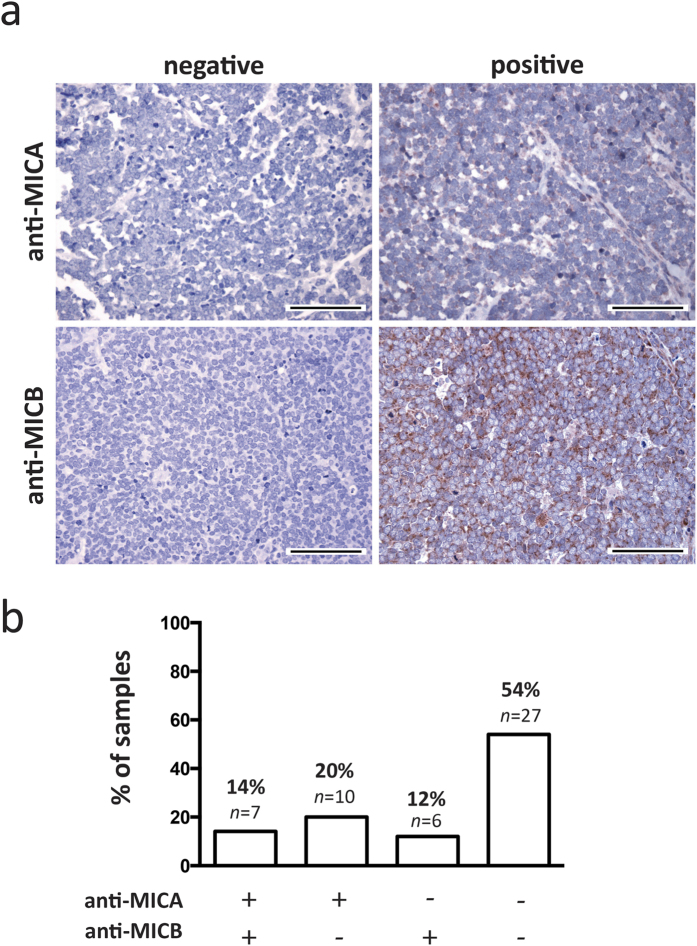
Figure 1. MICA and MICB expression of MCC tumors in situ.
MCC tumor samples from 34 patients were analyzed by immunohistochemistry for expression of MICA and MICB. (a) Samples were classified as positive or negative. Representative negative and positive samples are depicted at 40× magnification, scale bars are 100 μm. The positive examples represent the strongest obtained signal with the respective antibody. (b) Tumor samples were stratified into 4 groups: Double positive for MICA and MICB (+/+, 14%, n = 7), only positive for MICA (+/−, 20%, n = 10), only positive for MICB (−/+, 12%, n = 6), or double negative (−/−, 54%, n = 27).

