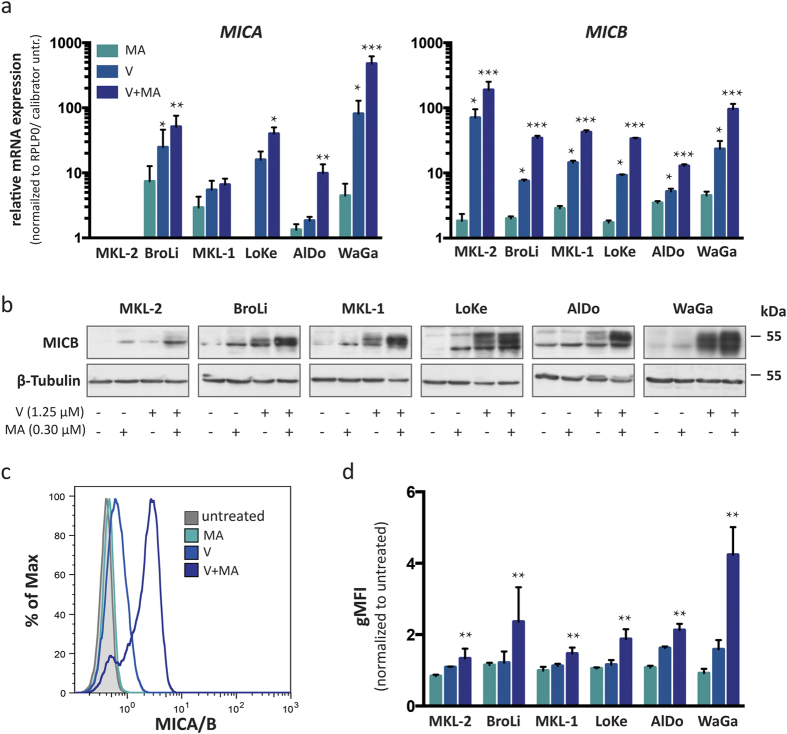
Figure 4. Induction of MICA and MICB expression by vorinostat alone or in combination with mithramycin A.
MICA and MICB mRNA and protein expression of untreated MCC cell lines were compared to the respective expression after treatment with vorinostat (V, light blue), mithramycin A (MA, turquoise), or the combination thereof (V+MA, dark blue). (a) mRNA expression of MICA and MICB was determined by qRT-PCR in duplicates in three independent experiments; CT values were normalized to RPLP0 and calibrated to the ΔCT value of the respective untreated cell line; relative mRNA expression is depicted on a logarithmic scale (log 10) ± SEM. (b) MICB expression in whole cell lysates of MCC cell lines was detected by immunoblot using a MICB specific antibody; β-tubulin served as loading control. (c,d) MICA/B cell surface expression was determined by flow cytometry using an antibody recognizing both MICA and MICB (clone 6D4), which is exemplified for WaGa (c); the results for all cell lines are depicted as the geometric mean fluorescence intensity (gMFI) of MICA/B staining, normalized to the respective untreated cell lines ± SEM in three independent experiments (d). Statistical analysis was performed using the Friedman test as indicated.

