
Figure 6. Influx and efflux of boron in the transgenic Arabidopsis lines expressing OsPIP1;3 and OsPIP2;6.
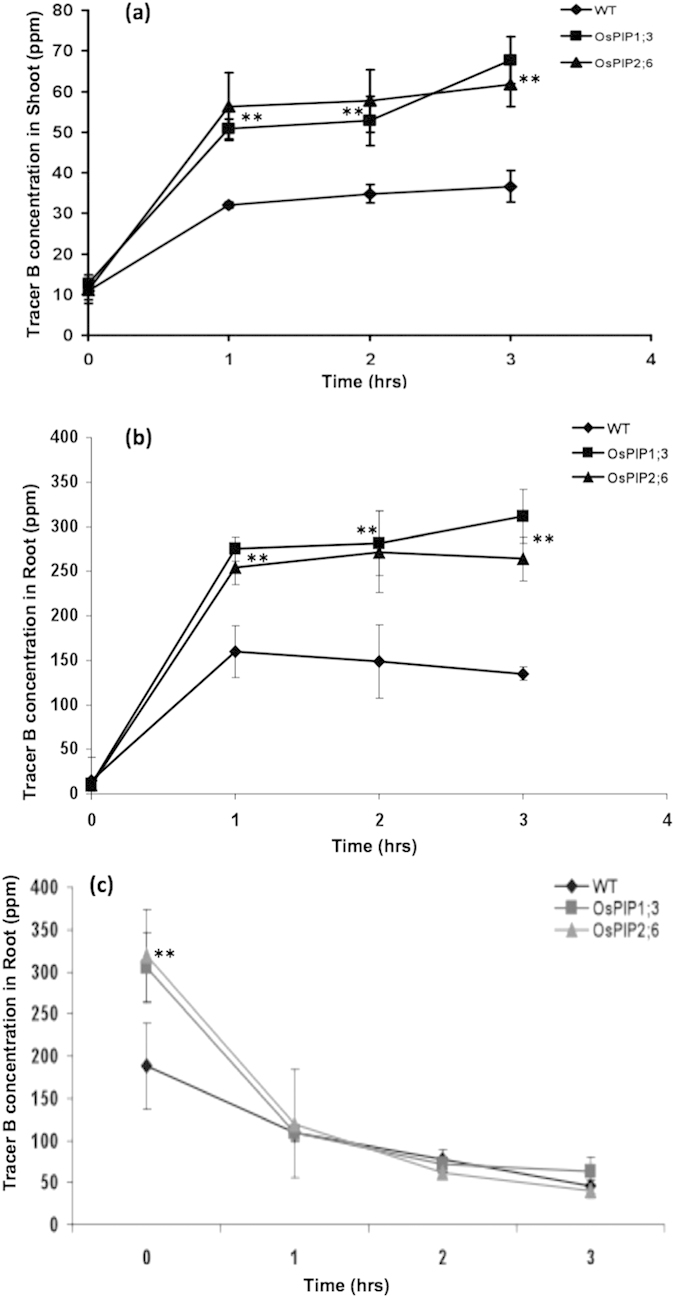
Concentration of tracer boron 10B in shoot (a) and roots (b) of transgenic Arabidopsis expressing OsPIP1;3 and OsPIP2;6 in comparison with wild type (WT) during short-term exposure to 2.5 mM 10B enriched boric acid for 1, 2, and 3 hrs. (c) Concentration of tracer boron 10B in roots of transgenic Arabidopsis expressing OsPIP1;3 and OsPIP2;6 in comparison with wild type (WT) during short-term efflux of 2.5 mM 10B enriched boric acid for 1, 2, and 3 hrs. The average and standard error (SE) values are presented for three replicates of 25 plants each for WT and transgenic Arabidopsis lines. The asterisks represent the significant difference in influx and efflux of B compared with wild type (WT) plants, *P < 0.05, **P < 0.01.