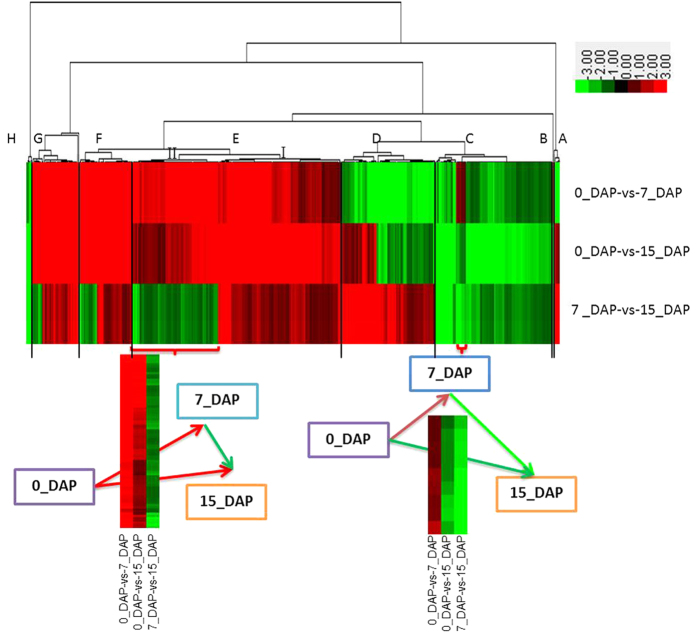
Figure 3. Cluster diagram of DEGs based on pairwise comparison among the three libraries (0_DAP, 7_DAP and 15_DAP) in radish.
Expression levels for DEGs for the three groups of pairwise comparisons were hierarchically clustered and shown in a heat-map. Level of expression was represented by color scale from green (down-regulated expression) to red (up-regulated expression), as indicated by a scale bar in the upper right corner. The dendrogram of distances were also shown for genes, names of which were presented in Supplementary Table S3. The two small heat-maps placed lower showed the enlarged view of the two sections in red braces.

