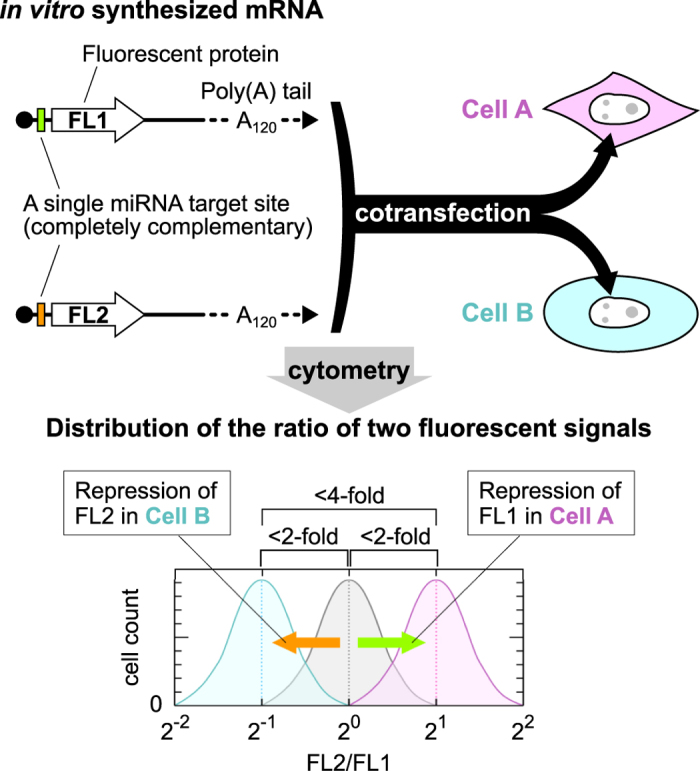
Figure 1. Schematic illustration of the high-resolution identification and separation of cell types.

Synthesized a pair of mRNAs encoding fluorescent proteins (FL1 or FL2) contain distinct miRNA target site in the 5′ UTR (shown in green or orange), an anti-reverse cap analogue (black circle) at their 5′ end, and a poly (A) tail of 120 nucleotides in length (A120). Two mRNAs were mixed and cotransfected into two cell populations (Cell A and Cell B) via lipofection. Twenty-four hours after the transfection, the cells can be analysed with a flow cytometer or a cell image analyser. The bottom panel shows a schematic histogram of the FL2/FL1 fluorescence signal ratios in transfected cells A (magenta) and B (cyan). A grey peak denotes the position of the cells with control mRNAs that lack miRNA target sites. Cell A and Cell B are separated based on less than two-fold differences in miRNA activities.
