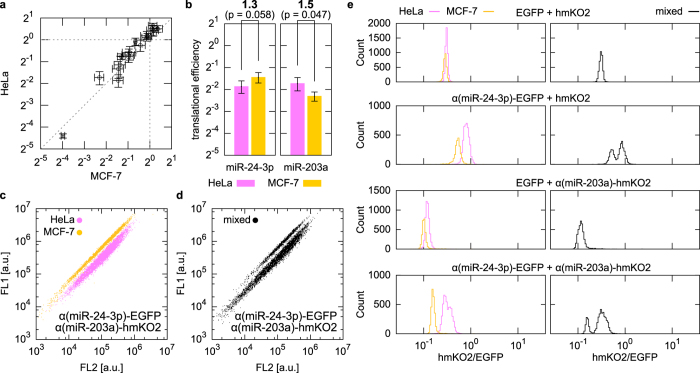
Figure 2. High-resolution identification and separation of HeLa cells and MCF-7 cells based on subtle differences in the activity of miR-24-3p (1.3-fold) and miR-203a (1.5-fold).
(a) Comparison of translational efficiencies of 20 miRNA-responsive mRNAs between the two cell lines. Error bars indicate the mean ± standard deviation (n = 3) in each line. The translational efficiency of control EGFP mRNA, which does not contain a miRNA target site, was normalized to 1. See Supplementary Table S1 for details. (b) Translational efficiency of two selected miRNA-responsive mRNAs in HeLa (magenta) and MCF-7 (yellow) cells. The numbers on top indicate the fold-change of the efficiency between the two lines, followed by p-values within parentheses. Error bars indicate the mean ± standard deviation (n = 3). (c) Dot plots of individually transfected HeLa (magenta) and MCF-7 (yellow) cells. (d) Dot plot of a mixed HeLa and MCF-7 cell population that were transfected with the same pair of mRNAs shown in (c). (e) Histograms of the fluorescence ratio in HeLa cells (magenta), MCF-7 cells (yellow), or their mixture (black) transfected with indicated pairs of mRNAs. The fluorescence ratio was defined as FL2 (hmKO2) intensity divided by FL1 (EGFP) intensity for each cell.

