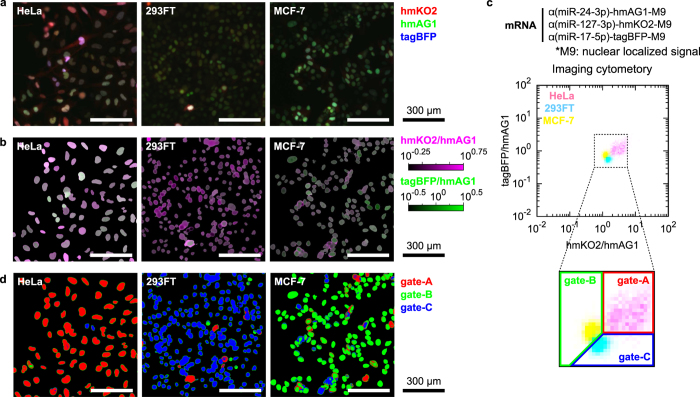
Figure 4. High-resolution identification of cell types with imaging cytometry.
(a) Fluorescent images of HeLa, 293FT or MCF-7 cells transfected with α(miR-24-3p)-hmAG1-M9, α(miR-127-3p)-hmKO2-M9 and α(miR-17-5p)-tagBFP-M9. Signals from hmKO2, hmAG1 and tagBFP were merged into red, green and blue channels, respectively. Scale bars denote 300 μm. (b) Processed images with pseudo-colours of the two ratios in the nuclei: hmKO2/hmAG1 (purple) and tagBFP/hmAG1 (green). (c) 2-D density of the three transfected lines obtained by imaging cytometry. The magnified region inside the dotted box shows how we partitioned data to specify HeLa (gate-A), MCF-7 (gate-B) and 293FT (gate-C) cells shown in (d). (d) Cell classification of the images. According to the fluorescence ratios, pixels in the images were pseudo-coloured with red (gate-A), green (gate-B) or blue (gate-C).

