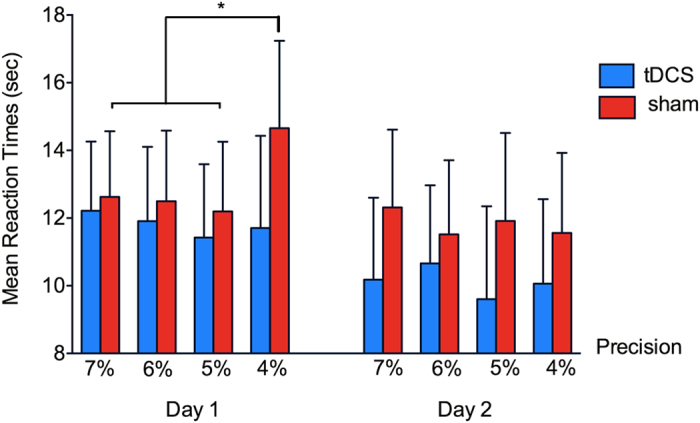
Figure 2. A 3-way interaction between Time, Precision and group for Mean RT of maths training on Day 1 and 2.

The source of this interaction was a significant 2-way interaction between Precision and group only for Day 1 (left panel). This interaction was due to a significant difference within the sham group between the hardest precision (4%), and 7% and 5%. Error bars indicate one standard error of mean (SEM).
