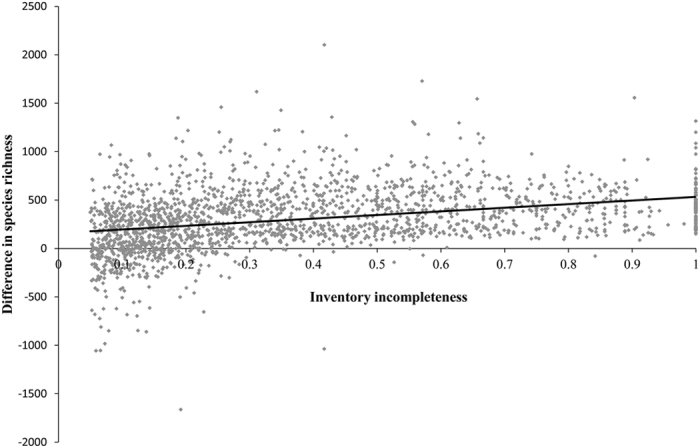
Figure 3. Difference in the number of vascular plant species between the dataset of this study and that of Yang et al. 42.

X-axis is the inventory incompleteness of vascular plants based on Yang et al.42 and Y-axis is the number of vascular plant species in the dataset of this study minus that of Yang et al.42. The mean and standard deviation in the difference in the number of vascular plant species between the two datasets were 305.2 and 314.3, respectively. Among the 2010 ‘under-sampled’ counties based on the definition of Yang et al.42, the inventory completeness in 87% of counties was greatly improved.
