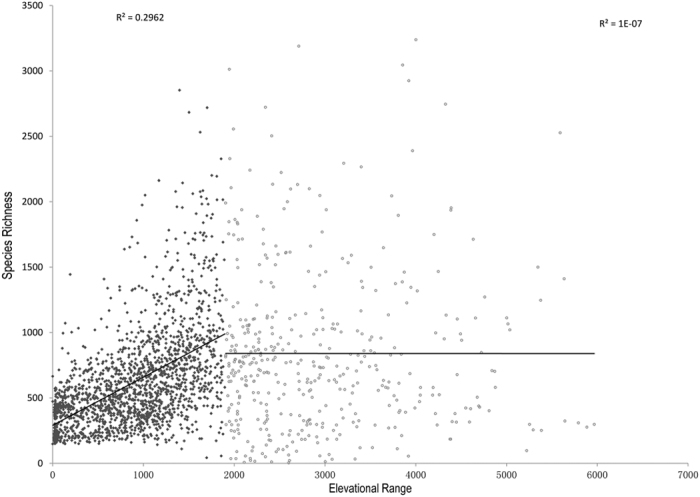
Figure 5. Relationship between elevational range and vascular plant species richness.

Counties with elevational range larger than 6,000 m were excluded in the analysis. The relationship is significant when elevational range is less than 1,900 m (R2 = 0.2962, F = 815.2, P < 0.001), beyond which the relationship is marginal (R2 = 0.0000, F = 0.02, P = 0.89).
