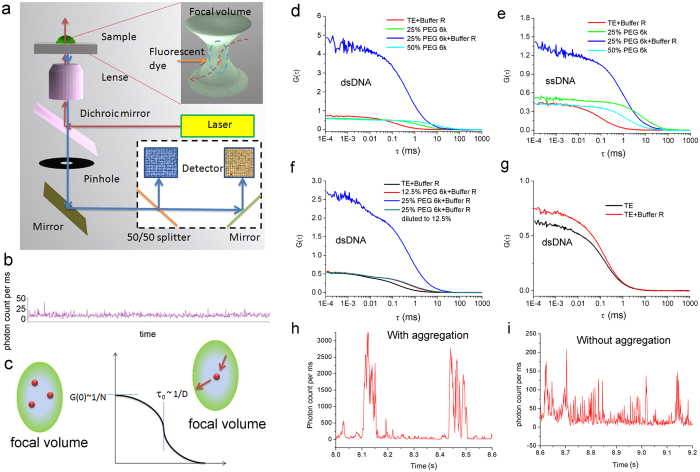
Figure 3. Formation of DNA nanoparticles with DNA fragments studied by FCS.
66 bp dsDNA and 66 nt ssDNA labeled with ATTO 488 dyes were used. (a) The FCS setup. A laser beam (488 nm) passes through a water-immersed object and focuses into a focal volume of a scale of hundreds of nanometers. The emitted fluorescence signal is collected, focused onto a pinhole by a lens, split into two and detected by avalanche photodiodes. (b) A typical FCS original signal collected by avalanche photodiodes. The fluorescence intensity reflects the number of photons collected by the detector. (c) A typical autocorrelation (cross-correlation) curve for a single-component sample solution. The amplitude of the FCS curves is inversely proportional to the number of fluorescence components in the focal volume. The characteristic diffusion time τ0 is inversely proportional to the diffusion coefficient of the tracers. From the FCS autocorrelation curves, we can trace the changes of the number and the size of labeled DNA molecules. In the presence of either 25% PEG 6K (d) or Buffer R (g), the concentration of DNA does not change obviously. However in the presence of both 25% PEG 6k and Buffer R, the amplitude and characteristic diffusion time of FCS autocorrelation curves decrease. Occasionally the FCS autocorrelation curves cannot be constructed based on the original fluorescence signal (h). The result indicates the formation of DNA nanoparticles. (e) The influence of PEG 6k and Buffer R on ssDNA is similar to dsDNA. Aggregation of dsDNA is a highly reversible process as a function of concentration of PEG 6k (f). The dsDNA sample in 12.5% PEG 6k has the same FCS autocorrelation curves as in PEG 6k which is diluted from 25% to 12.5%. (h,i) show FCS original signals with and without huge peaks.

