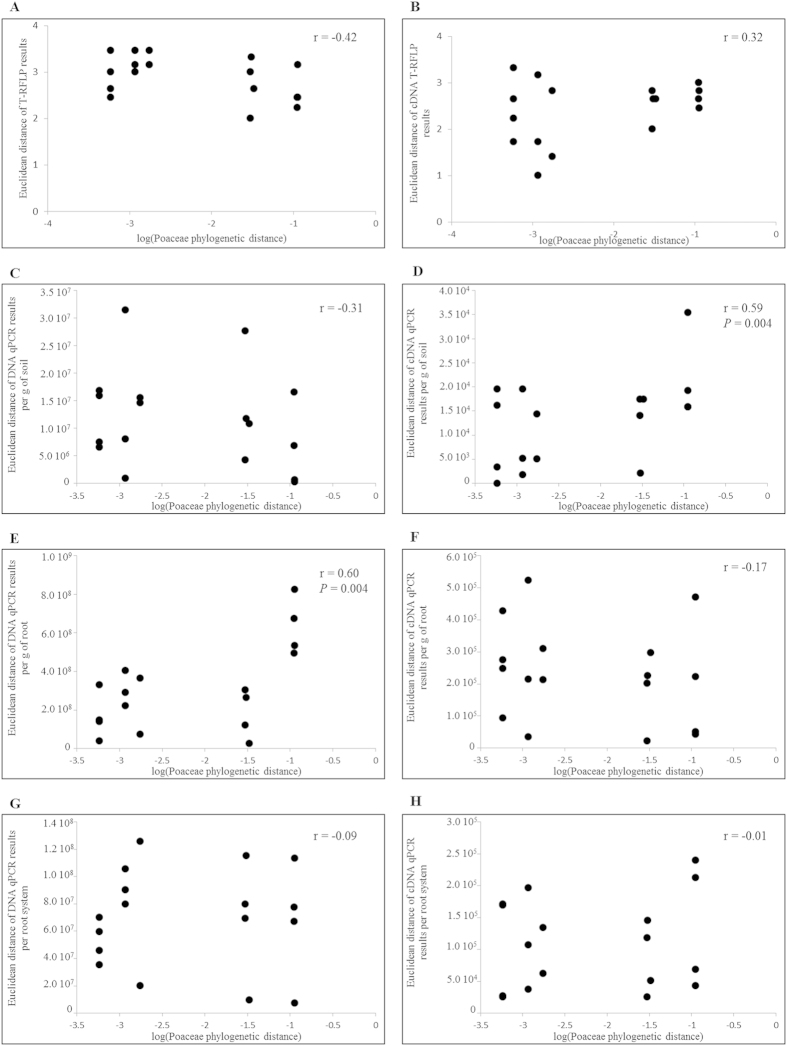
Figure 3. Pairwise comparisons (n = 18) of plant phylogenetic distance between Poaceae (X axis) with the corresponding distance between their root-associated diazotroph communities (Y axis).
nifH DNA data are shown to the left and nifH cDNA data to the right, and they correspond to results of T-RFLP (A,B), quantitative PCR or RT-PCR expressed per g of soil (C,D), per g of root (E,F) or per root system (G,H). Distances were calculated two by two, using Kimura 2 parameter model for plant phylogeny and Euclidean distance for diazotrophic community. The Pearson correlation coefficient and its probability level (when P < 0.05) are indicated.

