
Figure 3.
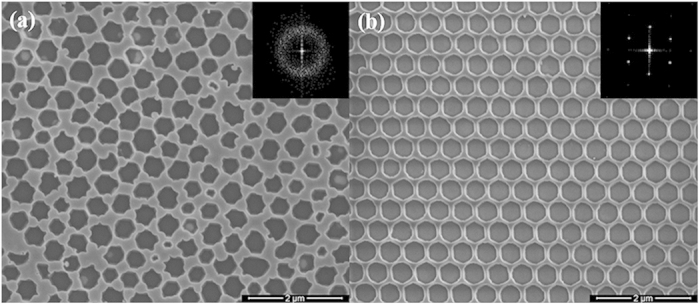
Top-view SEM images of (a) AAO_130 nm sample and (b) PhC_130 nm sample. The insets show the FFT of the SEM images. The pore arrays of AAO-LED show an amorphous structure, while those for PhC-LED show the 2D crystalline one. The lattice constant of the AAO template is 520 ± 40 nm.