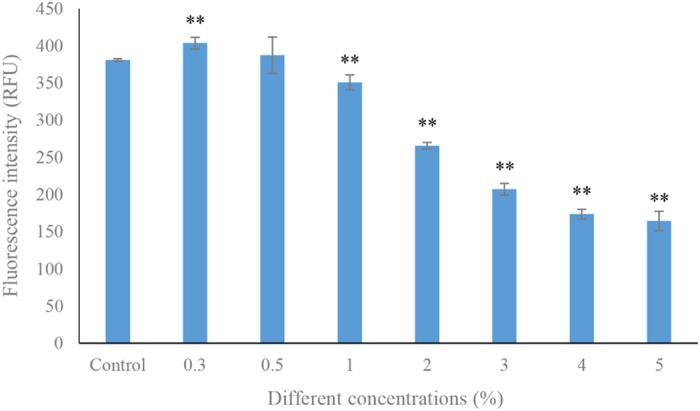
Figure 1. The algicidal rates in different concentrations of bacterial cultures.

All error bars indicate the SE of the three biological replicates. ** represents a statistically significant difference of p < 0.01 when compared to the control.

All error bars indicate the SE of the three biological replicates. ** represents a statistically significant difference of p < 0.01 when compared to the control.