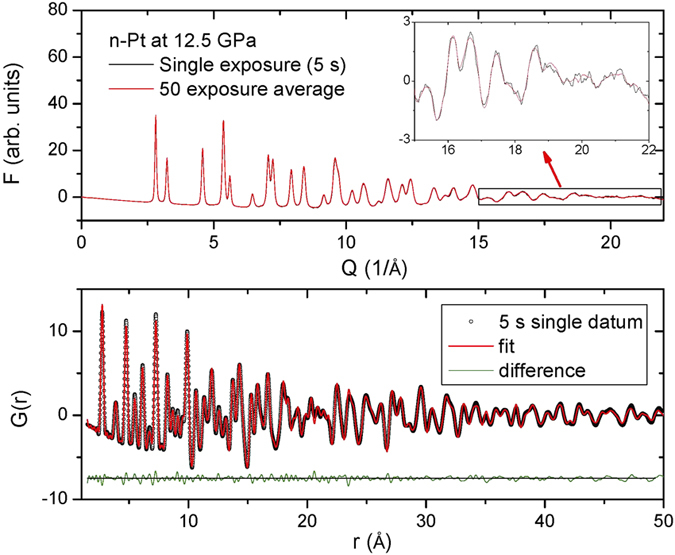
Figure 3. High-pressure pair distribution function (PDF) measurement of nano Pt (50 nm) at 12.5 GPa in M:E = 4:1 medium using a focused X-ray beam (66.054 keV).

(Upper panel) Reduced total scattering function, F(Q), for a single 5-s exposure (black) and 50 averaged datasets (red). Inset shows an expanded view in the high-Q range. (Lower panel) Points represent PDF, G(r), of a single 5 s exposure with Qmax = 21.5 Å−1 for the Fourier transform. Lines are the PDF fitting with a residual, Rw, of 0.105. The difference curve shown at the bottom is offset for clarity.
